Introduction
Amgen Inc. is not just a biotechnology company, it is one of the original pioneers that shaped the biotech industry as we know it today. Founded in 1980 and headquartered in Thousand Oaks, California, Amgen has become a symbol of innovation, transforming cutting-edge science into life-saving therapies that have touched millions of patients around the world.
Illustration 1: The Amgen logo, symbolising the company’s advancing capabilities in AI and data science.
Unlike traditional pharmaceutical firms that built their dominance on chemistry and small-molecule drugs, Amgen bet early on the future of biologics which is therapies created from living cells.
This daring strategy paid off spectacularly. Amgen helped launch the “biotech revolution” with drugs like Epogen and Neupogen, forever changing the treatment of anemia and cancer care.
Today, Amgen stands as one of the world’s largest independent biotech companies, with a product portfolio spanning oncology, immunology, cardiovascular medicine, bone health and rare diseases. Its bold acquisitions, advanced biologics manufacturing, and unmatched focus on genetics-driven medicine have positioned it at the forefront of the healthcare transformation of the 21st century.
The company’s philosophy is simple but powerful: Unlock the power of biology for patients suffering from serious illnesses. In an age when medicine is converging with genetics, AI, and data-driven discovery, Amgen remains one of the companies that can truly change the trajectory of human health.
History
Amgen’s story begins in 1980, when a group of scientists and visionaries founded Applied Molecular Genetics (AMGen) in Southern California. At the time, genetic engineering was still a radical, untested field.

Illustration 2: Amgen’s first labs in the early 1980s where the biotech revolution began.
Most pharmaceutical giants dismissed it as too speculative. But Amgen’s founders believed that decoding and manipulating DNA could unlock a new era of medicine.
The company’s first great breakthrough came in 1989, when the U.S. FDA approved Epogen (epoetin alfa), the world’s first recombinant human erythropoietin. This drug changed the lives of kidney disease patients by treating anemia and it became one of the fastest-growing biotech drugs in history.

Illustration 3: Amgen’s first breakthrough came through the drug Epogen which treats anemia.
Two years later came Neupogen (filgrastim), a therapy that boosted white blood cells in chemotherapy patients. For the first time, doctors could reduce the devastating immune side effects of cancer treatment. These early breakthroughs cemented Amgen’s reputation as the biotech company that delivers.
Through the 1990s and 2000s, Amgen expanded aggressively, both organically and through acquisitions. The purchase of Immunex in 2002 brought in Enbrel, a blockbuster treatment for autoimmune diseases such as rheumatoid arthritis and psoriasis. By then, Amgen was no longer a scrappy biotech startup, it was a full-fledged global pharmaceutical giant.
In the 2010s, Amgen doubled down on precision medicine and next-generation biology. The acquisition of Onyx Pharmaceuticals in 2013 brought in oncology assets like Kyprolis, while the purchase of deCODE Genetics in Iceland gave Amgen one of the largest and most detailed human genetic databases in the world.
Most recently, in 2023, Amgen made headlines with its $28 billion acquisition of Horizon Therapeutics, significantly expanding its rare disease portfolio. This deal was a statement: Amgen intends to remain a global biotech leader for decades to come.
Today, Amgen has more than 25,000 employees worldwide, operates major facilities in the U.S., Europe, and Asia, and maintains one of the most diverse and innovative pipelines in biotechnology.
Operations and Portfolio
Amgen is renowned for its ability to turn cutting-edge science into blockbuster therapies, consistently delivering medicines that transform the standard of care for millions of patients worldwide. Its portfolio covers a wide spectrum of therapeutic areas, making it one of the most diversified players in the biotechnology industry.
- Oncology
Amgen has long been a leader in oncology, developing therapies that push the boundaries of cancer treatment. The segment, which represents about 12% of revenues, is anchored by a strong lineup of targeted medicines that tackle some of the most challenging cancers.
These include Blincyto, a first-in-class bispecific T-cell engager that directs the immune system to attack leukemia cells; Lumakras, the first successful therapy to target the notoriously “undruggable” KRAS mutation; Kyprolis, which extends survival in multiple myeloma; and Vectibix, a monoclonal antibody that targets colorectal cancer with specific genetic markers. Together, they illustrate Amgen’s ability to transform cutting-edge science into life-saving therapies that change the future of oncology.
- Immunology
Autoimmune and inflammatory disorders remain one of Amgen’s strongest areas, generating roughly 18% of company revenues.

Illustration 4: Immunology remains one of Amgen’s key focus areas accounting for 18% of total revenue.
Key products include Enbrel, a long-standing cornerstone treatment for rheumatoid arthritis and related conditions; Otezla, a convenient oral therapy for psoriasis and psoriatic arthritis; and Tezspire, an advanced biologic for severe asthma developed in partnership with AstraZeneca.
- Cardiovascular Health
Cardiovascular diseases remain the leading cause of death worldwide, and Amgen plays a vital role in prevention. Roughly 15% of revenues come from this category.
Amgen’s key product is Repatha a PCSK9 inhibitor that slashes LDL cholesterol to unprecedented lows, preventing heart attacks and strokes.

Illustration 5: Amgen employees researching drugs.
- Bone Health
Bone health therapies contribute about 13% of total revenues, largely driven by two highly successful biologics: Prolia which is widely prescribed for osteoporosis, especially among postmenopausal women and Xgeva protecting cancer patients against skeletal complications when tumors spread to bone.
- Nephrology
Amgen’s history began with kidney disease, and nephrology products still generate around 8% of company revenues.
Epogen remains a cornerstone therapy for anemia associated with chronic kidney disease, while Aranesp, a longer-acting successor, provides enhanced convenience and efficacy. Additionally, Parsabiv addresses secondary hyperparathyroidism in dialysis patients, reinforcing Amgen’s leadership in renal care.
- Rare Diseases
The 2023 acquisition of Horizon Therapeutics added a high-growth rare disease portfolio, now representing about 12% of Amgen’s revenues.
Key products include Tepezza which is the first treatment for thyroid eye disease and Krystexxa a biologic breakthrough for uncontrolled gout.
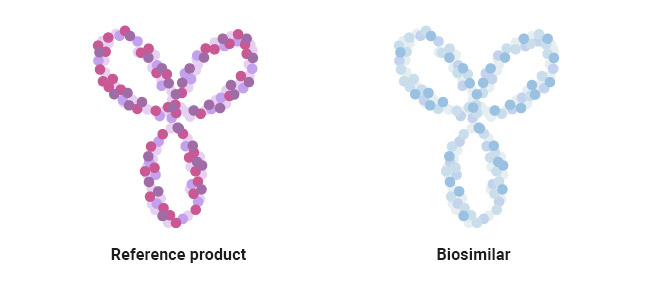
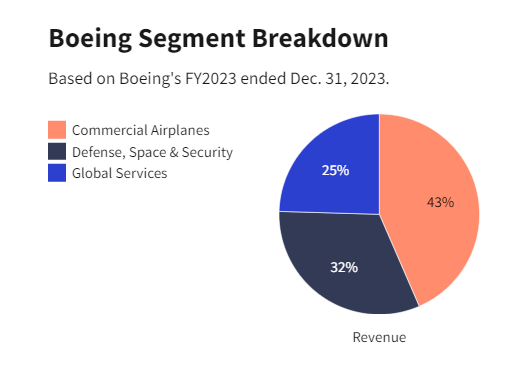
Illustration 6: Biosimilars is the largest revnue stream of Amgen accounting for around 20%.
- Biosimilars
Amgen has also built a robust biosimilars business, accounting for roughly 20% of total revenues. Biosimilars are biologic medical products that are highly similar to an existing, approved “reference” biologic medicine, with no clinically meaningful differences in safety, quality, or effectiveness.
They become available after the patent for the original biologic expires, offering more competition, increased market access, and potentially lower costs for patients and healthcare systems. Amgen is producing high-quality, lower-cost alternatives to blockbuster biologics like Humira, Avastin, and Herceptin.
Genetics and Precision Medicine
What truly sets Amgen apart is its genetics-first approach. Through deCODE Genetics in Iceland, Amgen analyzes genetic data from hundreds of thousands of individuals to identify disease pathways at the molecular level.

Illustration 7: deCode Genetics providing genetic data to Amgen.
This enables Amgen scientists to design drugs that target the root biological causes of disease, not just the symptoms. The company has applied this method to cardiovascular medicine (Repatha), oncology (Lumakras), and even neuroscience.
The crown jewel of this approach is Lumakras (sotorasib), the first therapy to target the infamous KRAS mutation in cancer once considered “undruggable.” This was a watershed moment in oncology, proving that genetic-driven drug discovery can crack the toughest challenges in medicine.
Key Competitors
Amgen competes in one of the most competitive industries in the world, facing rivals that include both traditional pharma giants and fast-moving biotech innovators. Under are some of the biggest competitors detailed:
- Pharma Giants
- Roche is a global oncology leader known for blockbuster biologics like Herceptin and compete in the same sector as Amgen.
- Novartis is a pioneer in gene and cell therapies, including Zolgensma.
- Pfizer is a multinational powerhouse with a broad biologics and vaccine portfolio.
2. Biotech Rivals
- Regeneron is strong in monoclonal antibodies and treatments for rare diseases.
- Gilead Sciences specializes in oncology and antiviral therapies.
- Biogen focuses on neurodegenerative and neurological disorders.
3. Disrupters & Innovators
- Moderna & BioNTech are leaders in mRNA technology with rapid-response vaccines and therapies.
- Vertex Pharmaceuticals is a specialist in cystic fibrosis and precision genetic medicines.
- CRISPR-focused firms (CRISPR Therapeutics, Intellia) are advancing revolutionary gene-editing therapies.
Competitive Advantage
Amgen’s advantages are as distinct as Toyota’s legendary production system. Its biologics manufacturing scale is unmatched, few companies can produce complex cell-derived medicines at Amgen’s level of quality and consistency.

Illustration 8: Amgen’s products placed in a pharmacy
Its genetics-driven R&D provides a cutting-edge edge over traditional pharma. By integrating deCODE Genetics, Amgen doesn’t just test hypotheses it designs them from the genetic blueprint of human disease.
Add to this its balanced portfolio (innovator biologics + biosimilars + acquisitions) and you have a company with both stability and upside. By combining innovator biologics, high-quality biosimilars, and strategic acquisitions such as Horizon Therapeutics, the company achieves a blend of stability and growth potential.
This diversified strategy reduces dependency on any single product or therapeutic area while creating multiple revenue streams that can fuel future innovation.
Perhaps most importantly, Amgen has demonstrated a capacity for bold adaptation. The company continues to expand into new therapeutic frontiers, including RNA therapies, cell and gene therapy, and precision medicine, positioning itself for the next generation of biotech breakthroughs.
Its forward-looking approach, combined with operational excellence and a strong pipeline, makes Amgen a resilient leader capable of sustaining growth and innovation in an intensely competitive industry.
Future Outlook
Amgen is at a pivotal moment in biotech history. The company is leading in oncology (Lumakras), expanding in rare diseases (Horizon), and pushing into new frontiers like cell therapy, gene editing, and RNA-based medicine.
It aims to build therapies that don’t just treat disease but potentially cure it, a shift that could redefine healthcare economics worldwide.Its biosimilar pipeline ensures continued global presence, particularly in emerging markets, while its genetics-first innovation model promises a steady stream of breakthroughs.
Illustration 9: Amgen is well equipped for the future
As the biotech race accelerates from mRNA to CRISPR to gene therapies, Amgen has the resources, scale, and scientific firepower to remain a central player in the future of medicine.
In short: Amgen is not just a biotech stock, it’s a bet on the future of healthcare itself.
Stock Analysis
In this section we will analyze Amgen’s stock to see if it is a good stock to buy or not. Our philosophy is value investing meaning that we try to find good quality companies that are undervalued. However, we will give a holistic overview so all kind of investors with different philosophies can judge the stock for themselves.
Revenues and Profits
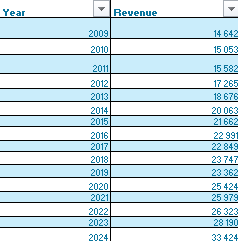
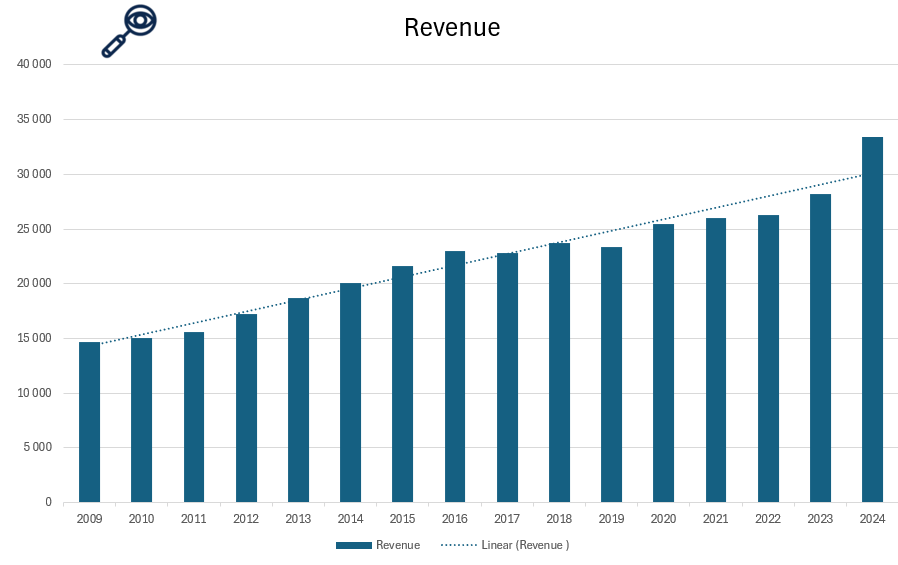
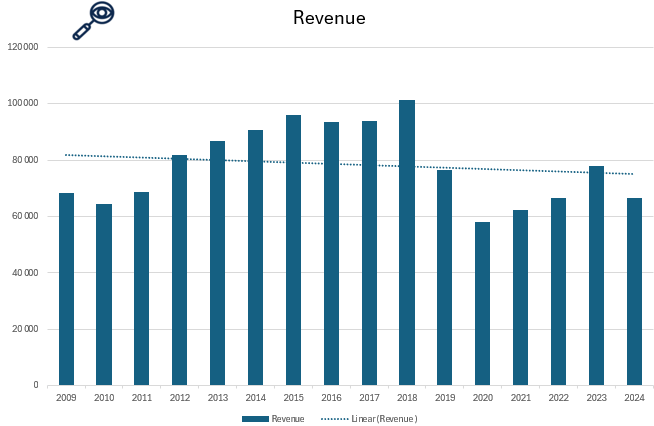
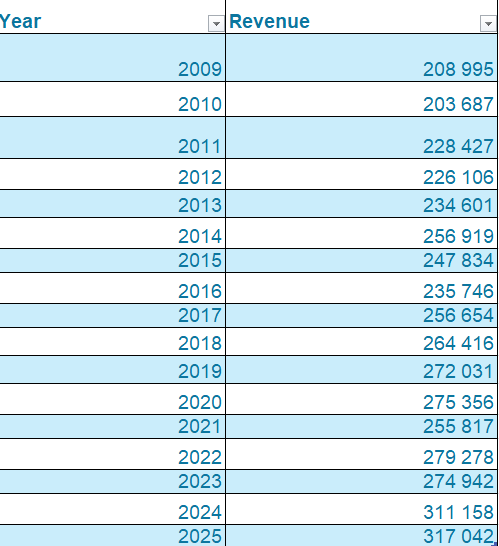
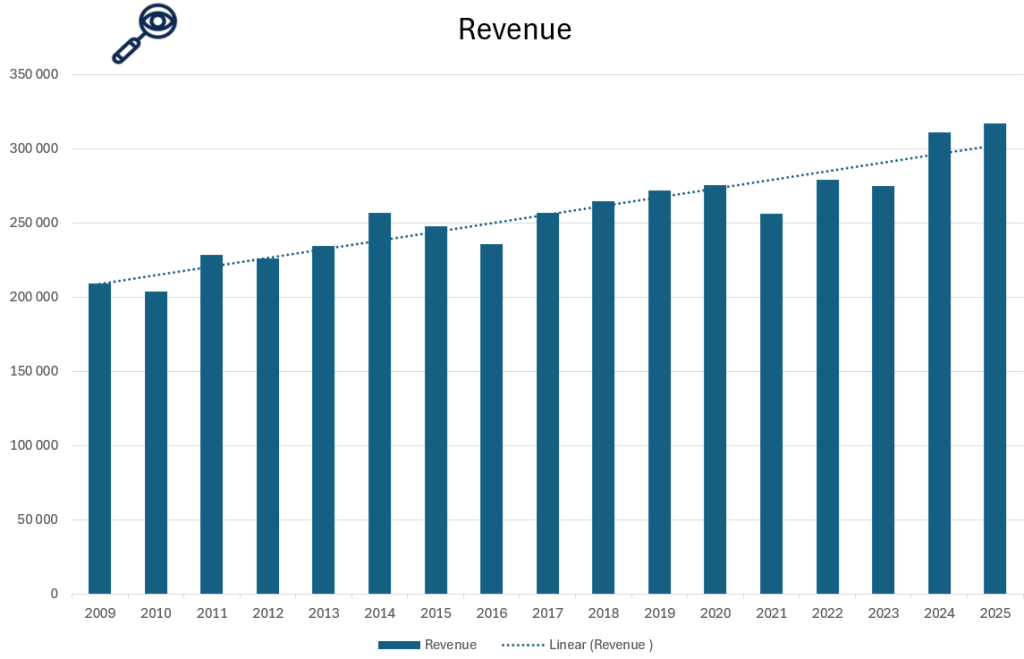
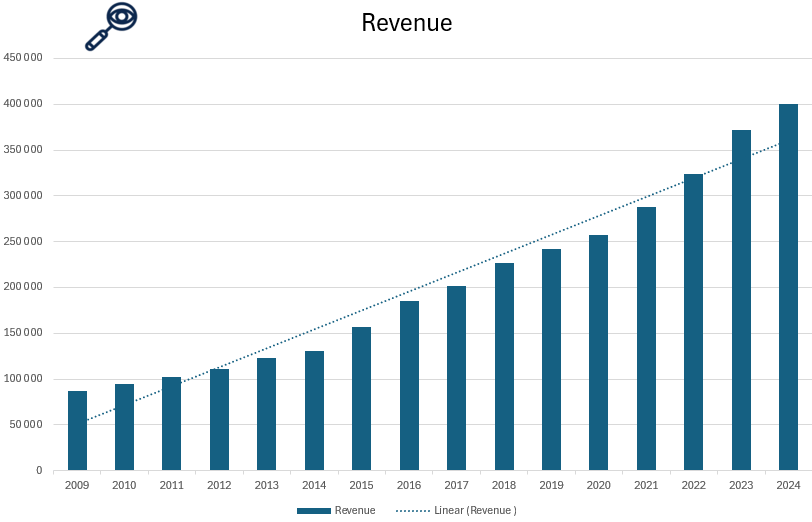
Illustration 10 and 11: Revenue of Amgen from 2009 to 2024
Amgen has demonstrated steady and consistent revenue growth over the years, reflecting disciplined operations and strategic investments. From approximately $14.6 billion in 2009 to an estimated $35.4 billion in 2025 which is a green flag as it has maintained a smooth upward trajectory.
This consistent growth underscores Amgen’s resilience and strategic foresight. The company’s balanced portfolio, encompassing innovator biologics, biosimilars, and acquisitions, has contributed to its stability and upside potential. Moreover, Amgen’s adaptability is evident in its expansion into new therapeutic areas, investments in RNA therapies, and positioning for the age of cell and gene therapy. These factors collectively make Amgen a compelling choice for value investors seeking stability and growth.
However, Amgen has had a reduction in its revenue growth such as from 2016 to 2017 or from 2018 to 2019 mainly due to the very high competition in the healthcare sector. These developments should always be closely watched by a potential investor.

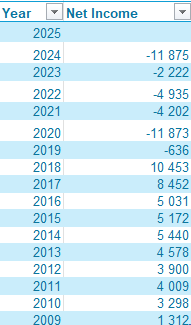
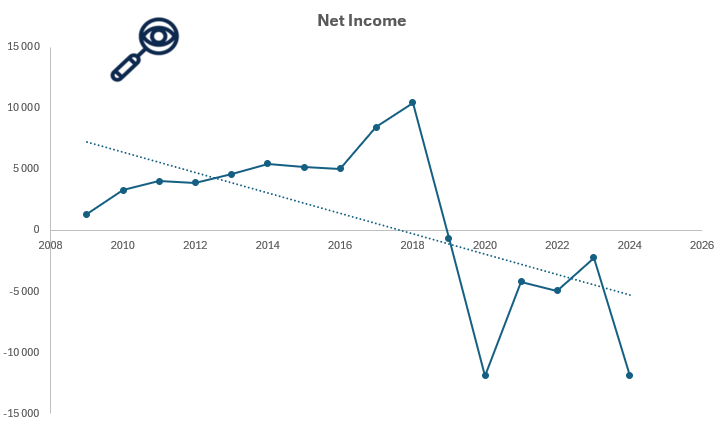
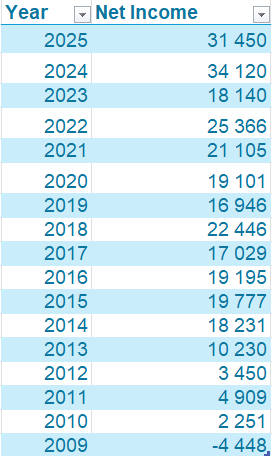
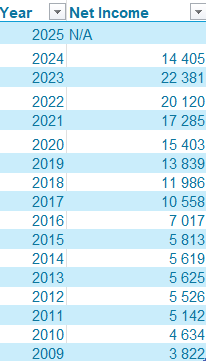
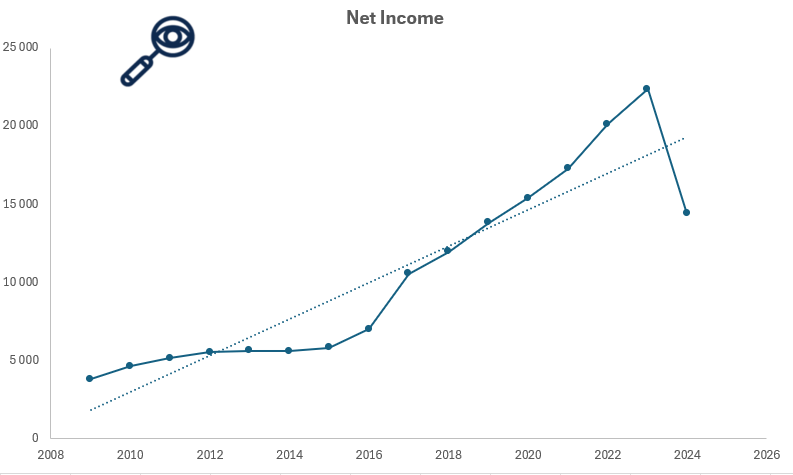
Illustration 12 and 13: Net Income of Amgen from 2009 to 2024
Net income is a crucial metric to evaluate when determining whether a company is a worthwhile investment. It represents a company’s net profit or loss after accounting for all revenues, income items, and expenses, calculated as Net Income = Revenue – Expenses.
Amgen’s revenue trajectory has exhibited notable volatility, with significant declines observed in 2017 and 2024, signaling potential concerns for investors. While Amgen’s diversified portfolio and strategic acquisitions have positioned it for long-term growth, the observed volatility in net income raises concerns about its financial stability. Investors should carefully consider these factors when evaluating Amgen’s investment potential. The decline in 2024 was due to its obesity drug test results failing to meet expectations while its general volatility is due to the higly competitive pharma market leading to lower drug prices.
Revenue Breakdown
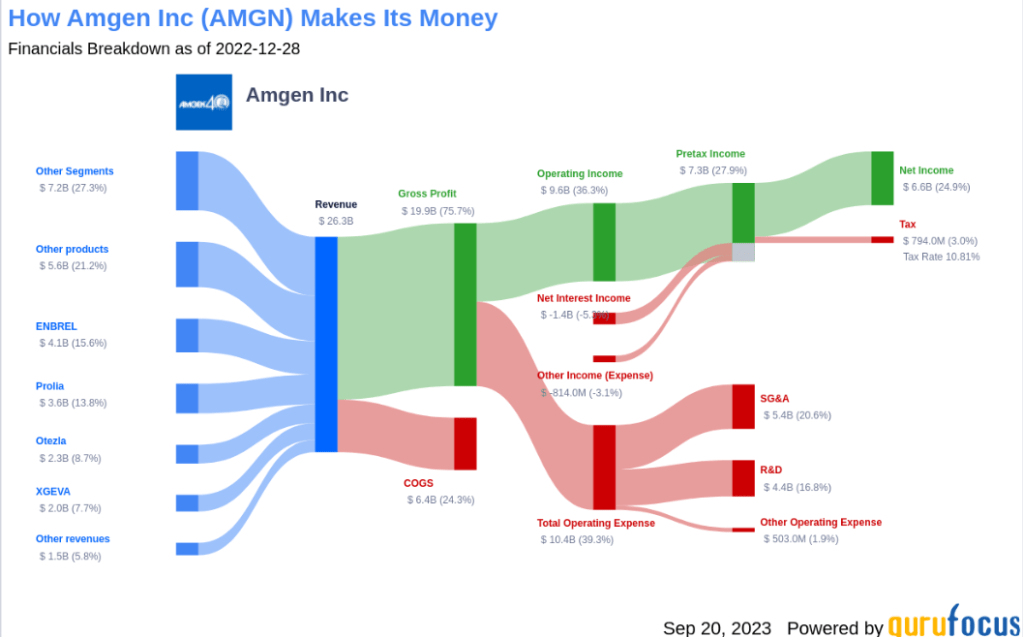
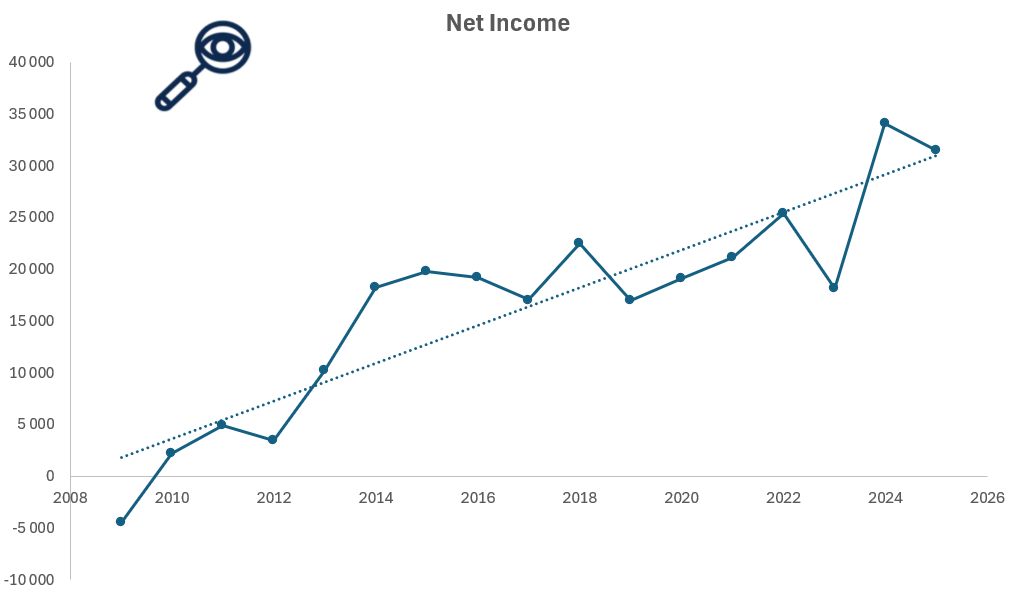
Illustration 14: Amgen Revenue breakdown gathered from gurufocus.
As shown in Illustration 12, Amgen’s core biologics and innovative therapies remain its largest revenue driver, consistently contributing roughly 65–70% of total revenue. This includes sales of blockbuster products such as Enbrel, Repatha, Prolia, and Neulasta across global markets. Amgen’s diverse portfolio spans oncology, cardiovascular, bone health, and nephrology, providing broad therapeutic coverage and strong patient demand. Its leadership in monoclonal antibodies and targeted therapies has been a key factor in sustaining recurring revenues from both established and new products.
In addition to innovator biologics, Amgen’s biosimilars business contributes around 20% of total revenue, offering lower-cost alternatives to widely prescribed biologics like Humira, Avastin, and Herceptin. This segment supports Amgen’s growth by expanding patient access and diversifying revenue streams, particularly in regions with pricing pressure on branded drugs.
Amgen also generates revenue from recent acquisitions, including Horizon Therapeutics, which accounts for roughly 10–12% of total revenue. Horizon’s rare disease therapies, such as Tepezza and Krystexxa, have become significant growth drivers and complement Amgen’s existing portfolio by targeting high-value, specialty markets.
Emerging technologies, including RNA therapies, gene therapy programs, and cell therapy initiatives, currently contribute a smaller portion of revenue, estimated at 2–3%, but are central to Amgen’s long-term innovation strategy. Heavy investment in R&D approximately 21% of revenue underpins the development of next-generation biologics and precision medicine, ensuring future competitiveness.
Overall, Amgen’s revenue structure reflects both stability and forward-looking diversification. Its core biologics provide predictable cash flow, biosimilars and acquisitions drive growth and resilience, and emerging therapeutic technologies position the company for leadership in an evolving biotech landscape.
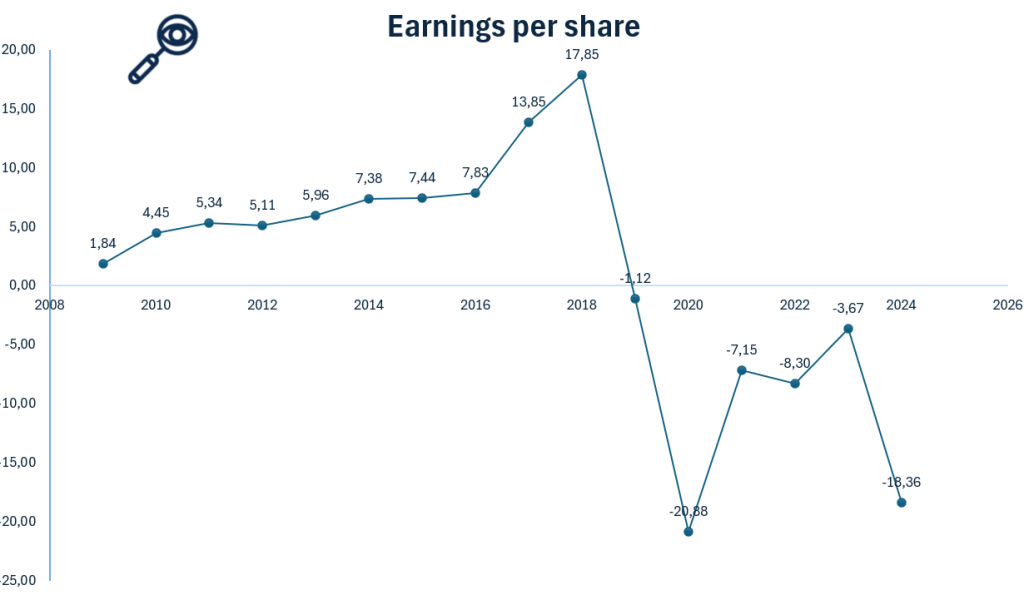
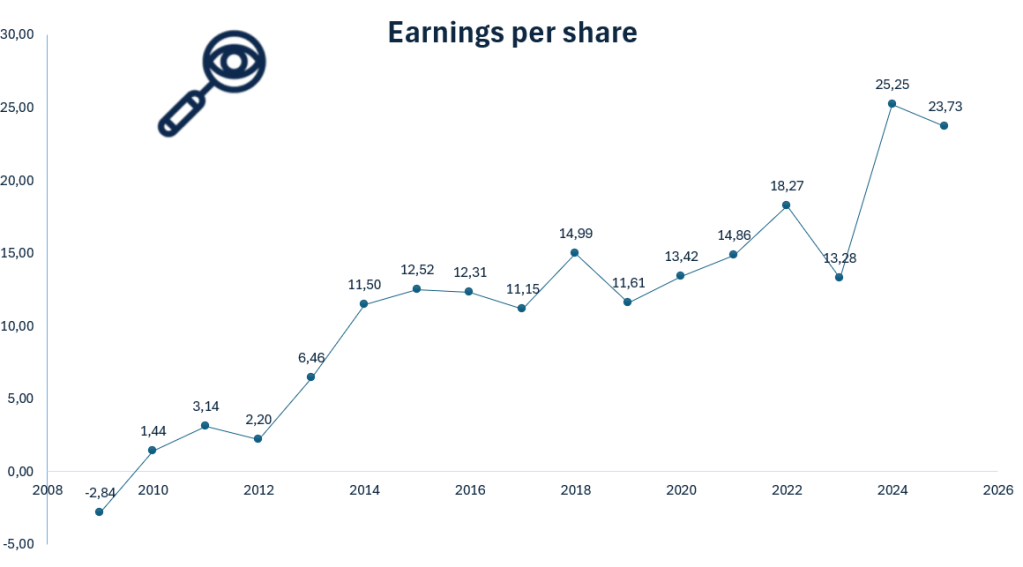
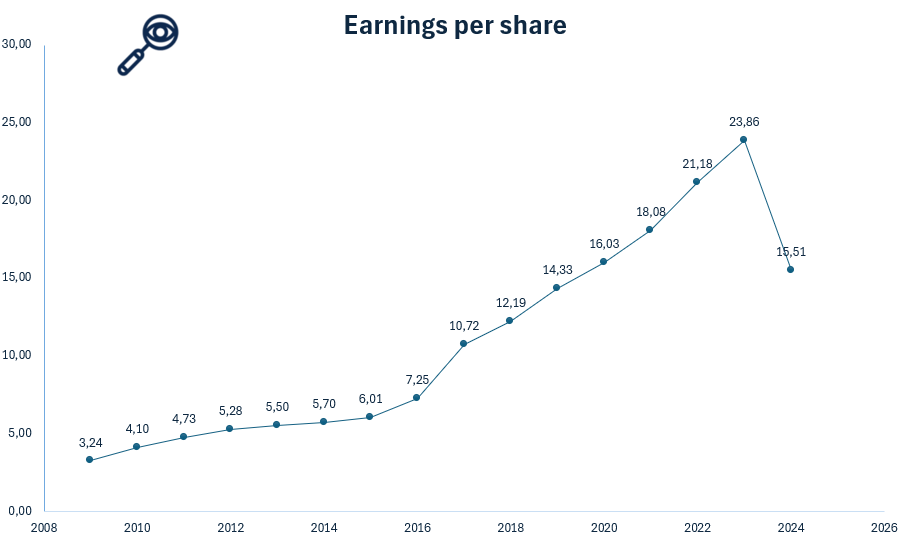
Earnings per Share
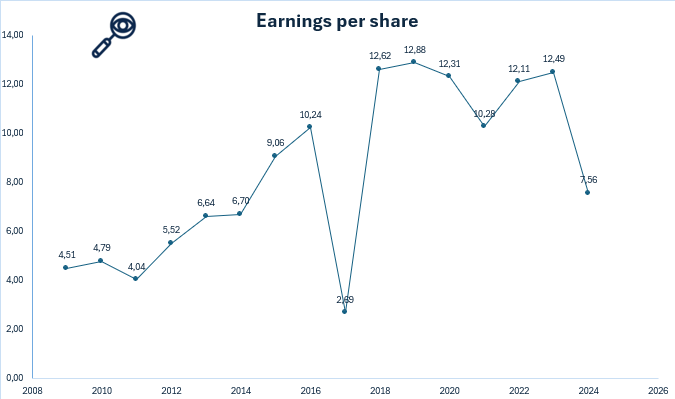
Illustration 15: Earnings per share for Amgen from 2009 to 2024
Earnings Per Share (EPS) is a key financial metric that measures a company’s profitability on a per-share basis. It indicates how much profit a company generates for each outstanding share of its stock, and is used to assess a company’s financial health, profitability, and potential for growth. In other words this metric can tell us how profitable the business is.
Amgen’s earnings per share (EPS) from 2009 to 2024 has shown significant volatility, rising and falling in response to competitive pressures and strategic investments. While EPS grew from around $4.51 in 2009 to an estimated $12.49 in 2023, the journey was uneven, with sharp declines in 2017 due to biosimilar competition impacting Enbrel, Neulasta, and Epogen, and again in 2024, when higher operating expenses, acquisition-related costs from Horizon Therapeutics, and mark-to-market losses weighed on profitability.
This volatility underscores that, while Amgen has strong long-term growth potential driven by its innovative biologics, biosimilars, and emerging therapies in RNA and gene editing, it also presents a potential red flag for investors. The swings in EPS reflect sensitivity to competitive dynamics, pricing pressures, and strategic investment decisions, emphasizing the importance of careful evaluation for those seeking stable returns in the biotech sector.
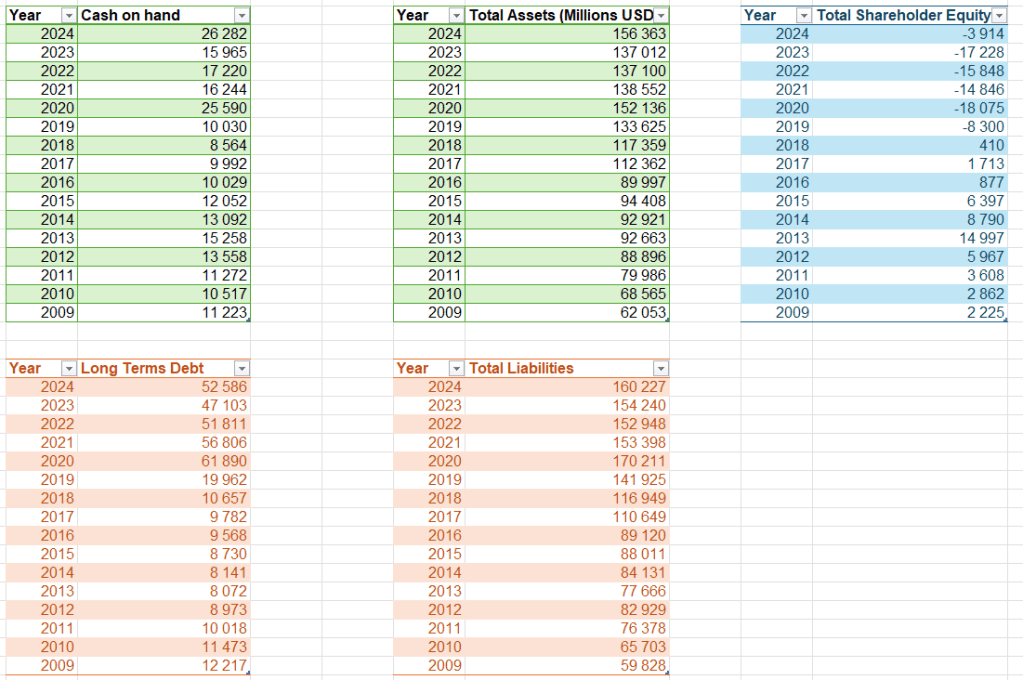
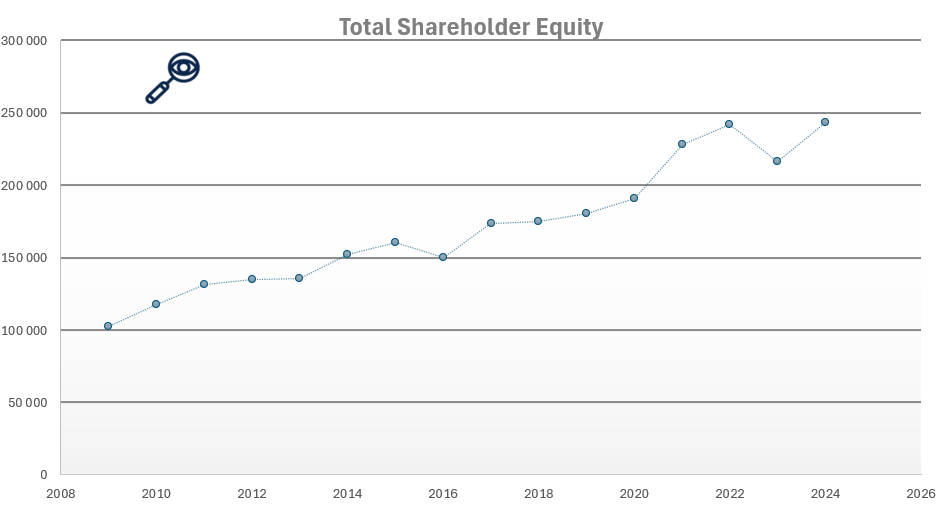
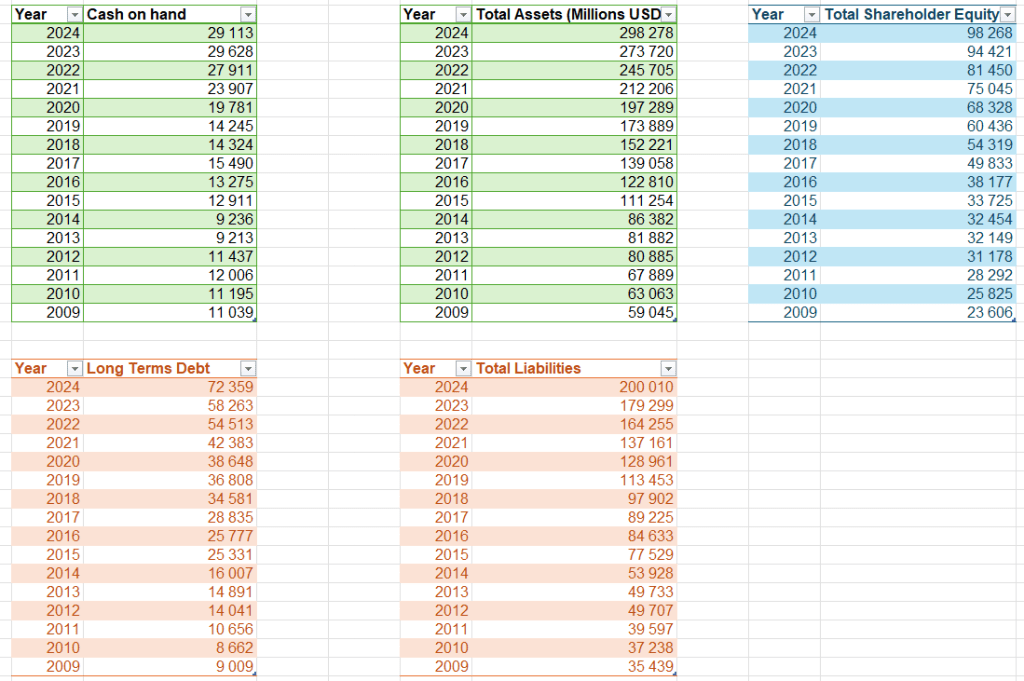
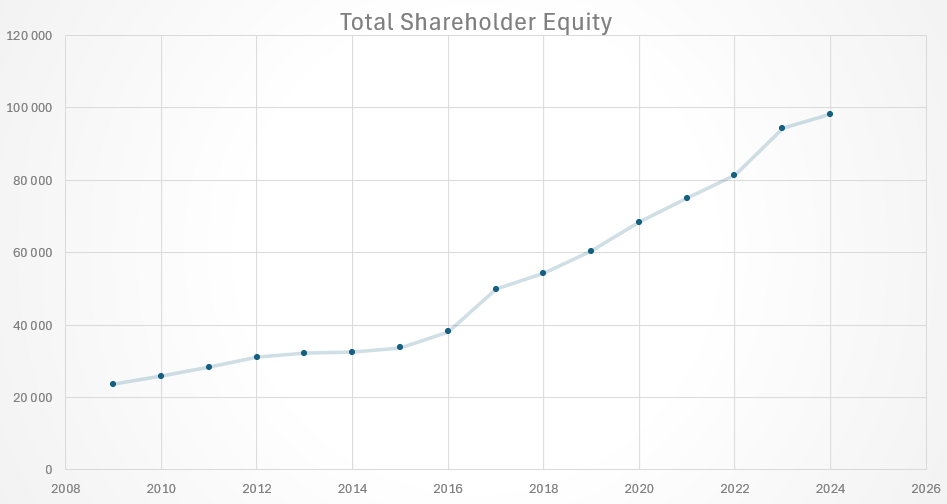
Assets and Liabilities
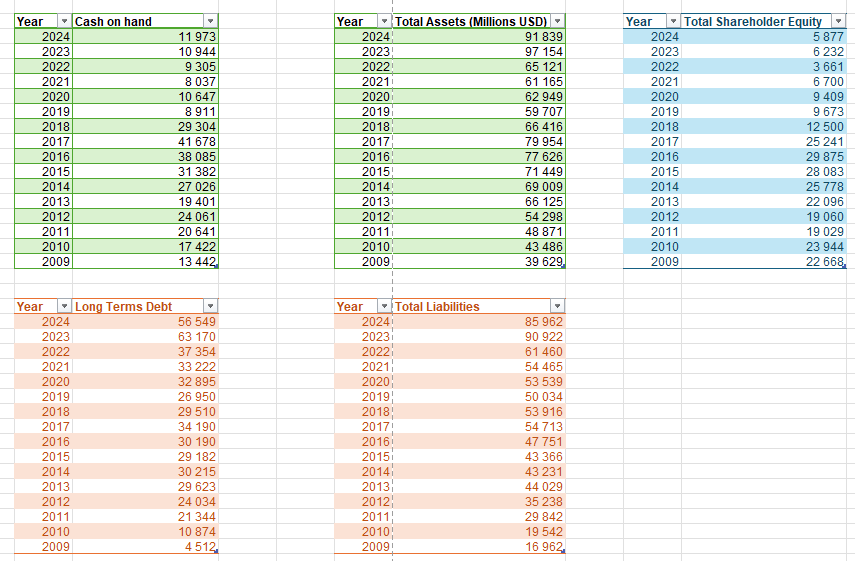
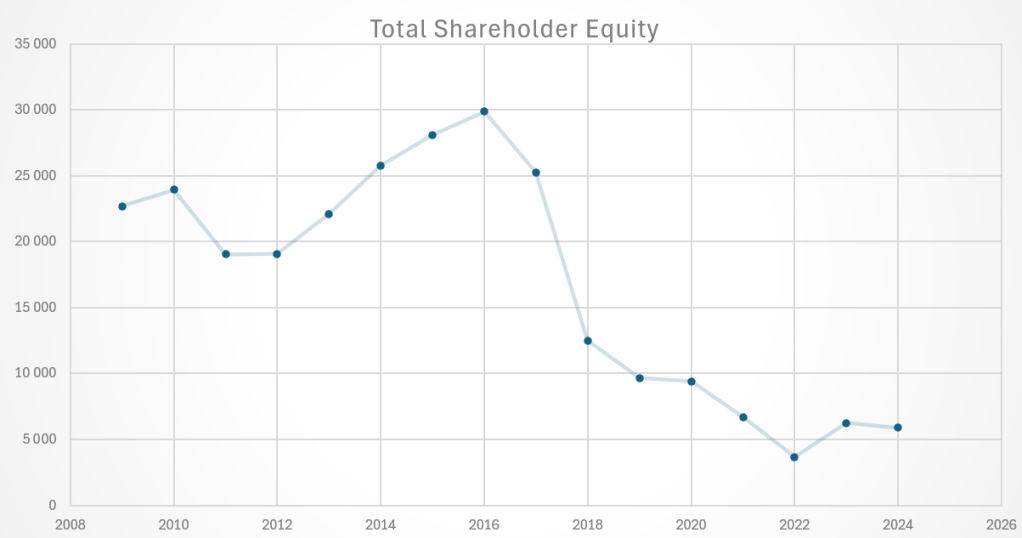
Illustration 16 and 17: Assets and Liabilities for Toyota from 2009 to 2024
When evaluating a company as a potential investment, understanding its assets and liabilities is crucial. If a local business owner offered to sell their shop to you, one of the first questions. after determining its profitability, would be about its equity and assets. The same principle applies when assessing publicly traded companies like Amgen.
As shown in Illustrations 16 and 17, Amgen’s cash on hand has fluctuated significantly between 2009 and 2024. While it stood at approximately 13.4 in 2009, it declined to around 11.9 in 2024. This volatility is concerning for investors, as stable or growing cash reserves are generally seen as a sign of financial resilience. Moreover, unlike many of its industry peers that have steadily built stronger liquidity positions over time, Amgen has not demonstrated the same upward trajectory, raising questions about its ability to generate and retain cash.
What is particularly troubling is that Amgen’s cash on hand remains well below its long-term debt obligations. This imbalance suggests that the company may face challenges in meeting debt repayments without relying heavily on external financing or sacrificing future growth opportunities. For potential investors, this combination of fluctuating liquidity, lack of upward trend, and high leverage signals a weaker financial cushion, an important risk factor to consider before making an investment decision.
Amgen’s total assets have increased steadily from USD 36.9 billion in 2009 to USD 91.8 billion in 2024, a positive indicator for potential investors as it reflects consistent expansion and resource growth. However, this comes with a caveat: the company’s total liabilities have also risen sharply, climbing from USD 16.9 billion in 2009 to USD 85.9 billion in 2024. Such a steep increase signals a growing reliance on debt financing, which can limit financial flexibility and elevate risk.
This trend has had a clear impact on shareholder equity, which has declined significantly over the period. For investors, this is a red flag, as shrinking equity reduces the financial cushion that protects shareholders in times of stress. Notably, the sharp drop in equity between 2016 and 2017 was largely driven by aggressive share buybacks combined with increased debt, which eroded the company’s balance sheet strength.
In summary, while Amgen’s asset growth highlights its ability to expand operations and generate value, the simultaneous surge in liabilities and erosion of equity paint a more cautious picture. For potential investors, this combination raises concerns about long-term sustainability, leverage management, and the balance between rewarding shareholders in the short term versus safeguarding financial stability for the future.
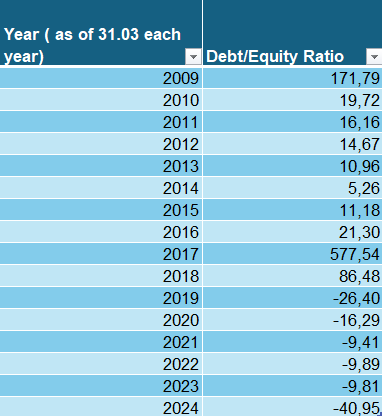
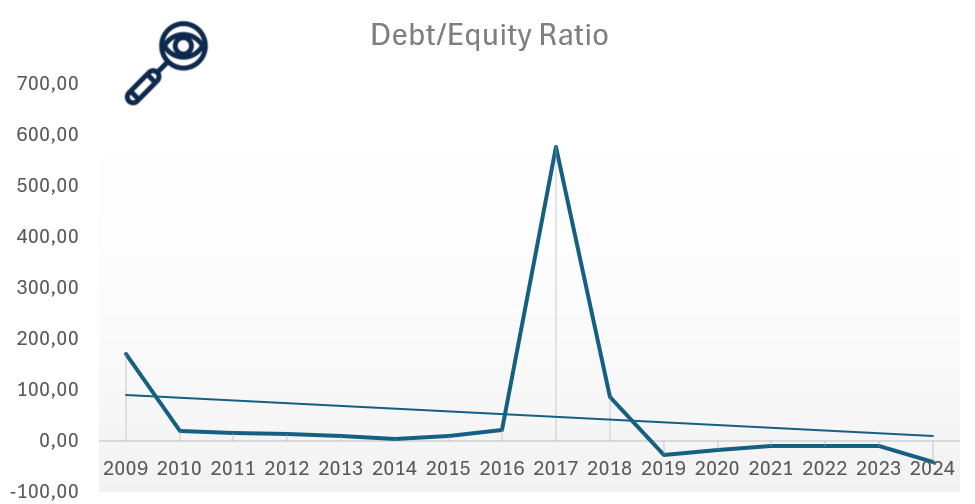
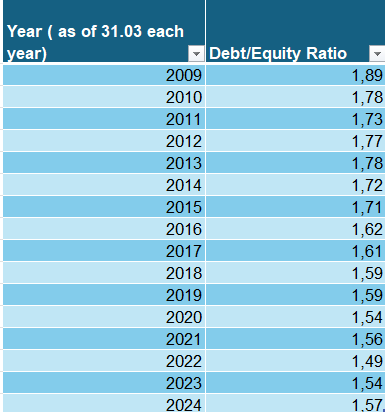
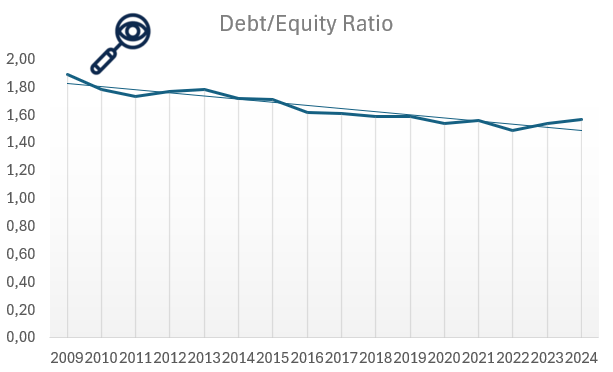
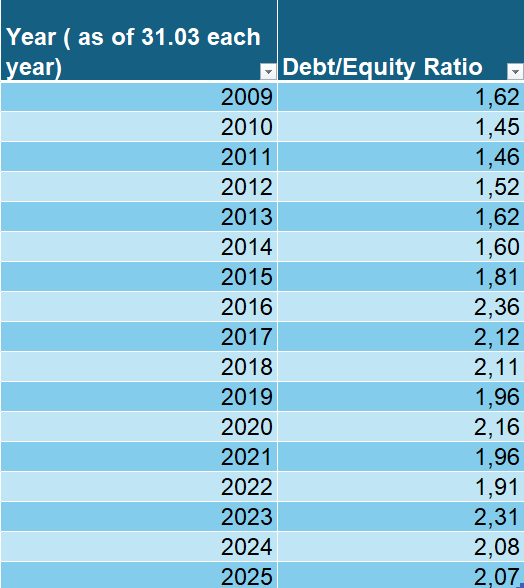
Debt to Equity Ratio
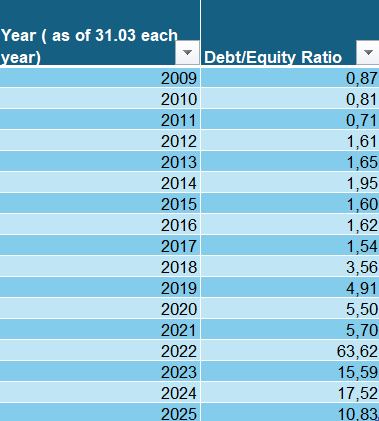

Illustration 18 and 19: Debt to Equity ratio for Amgen from 2009 to 2024
The Debt-to-Equity (D/E) ratio is an important financial metric for assessing a company’s financial leverage and risk. It compares the amount of debt the company uses to finance its operations relative to its shareholder equity. A high D/E ratio suggests that the company relies more heavily on debt to fuel growth, which could increase financial risk, especially during economic downturns when managing debt obligations becomes more challenging. In contrast, a lower D/E ratio indicates that the company is primarily financed through equity, reducing financial risk but potentially limiting its ability to rapidly expand.
Legendary value investor Warren Buffett generally prefers a debt-to-equity (D/E) ratio below 0.5. In stark contrast, Amgen’s D/E ratio stood at an alarming 10.83 in 2024, underscoring its heavy dependence on debt financing. Even more concerning, Amgen’s D/E ratio has been on an upward trajectory from 2009 through 2025, reinforcing the picture of mounting leverage and growing financial risk.
The ratio spiked sharply between 2021 and 2022, a period likely linked to heightened borrowing or shareholder distributions, before experiencing a notable decline from 2022 to 2023 as equity levels temporarily stabilized or debt levels adjusted. Nevertheless, the overall trend remains troubling: Amgen’s capital structure is overwhelmingly debt-driven, which raises red flags for investors seeking long-term stability.
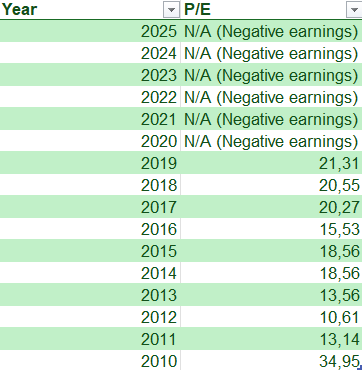
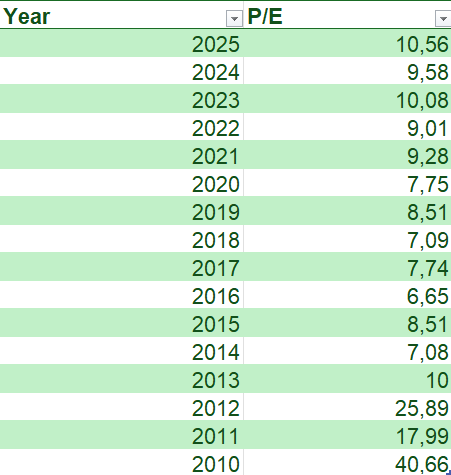
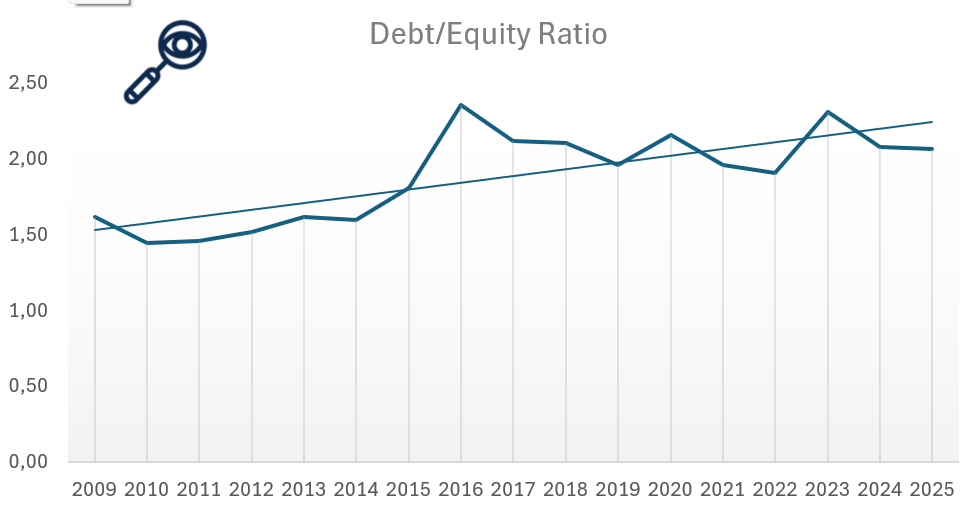
Price to earnings ratio (P/E)
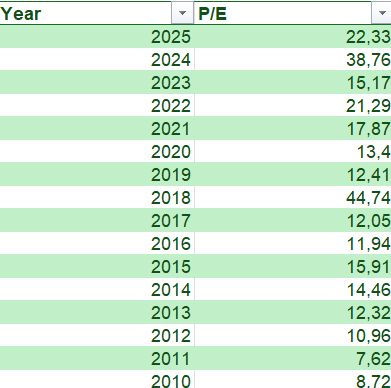
Illustration 20 and 21: PE ratio for Amgen from 2010 to 2025
For value investors, one of the most critical metrics when evaluating Amgen’s stock is the price-to-earnings (P/E) ratio, as it helps assess whether the company is undervalued or overvalued. Even if a company has strong financials, purchasing its stock at a high price can lead to poor returns. For example, imagine a business generating solid profits of $1 million per year. If the owner offers to sell you the business for just $1, it would be an incredible deal. But if the owner asks for $1 trillion, even though the business is profitable, the price would be absurdly overvalued. The stock market works similarly, companies can be priced cheaply on some days and excessively expensive on others.
Warren Buffett, a legendary value investor, typically considers stocks with a P/E ratio of 15 or lower as “bargains.” A high P/E ratio suggests that investors are paying a premium for the company’s earnings, expecting significant growth. In 2010, Amgen’s P/E ratio stood at around 8.72, aligning with Buffett’s preferred range. However, in subsequent years, the ratio trended upward, reflecting growing investor confidence in its earnings potential. This relatively elevated valuation suggests that investors are pricing in continued earnings stability and growth from Amgen’s biotechnology portfolio, but it also signals that the stock is not necessarily trading at a deep discount. For value-oriented investors, Amgen’s current P/E ratio may appear less attractive compared to traditional “bargain” opportunities. However, for growth-leaning investors, the premium could be justified if Amgen continues to deliver strong R&D output, sustain its drug pipeline, and expand into new therapeutic areas.
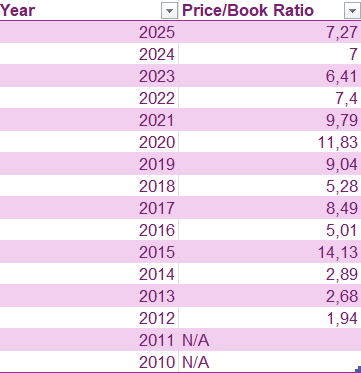
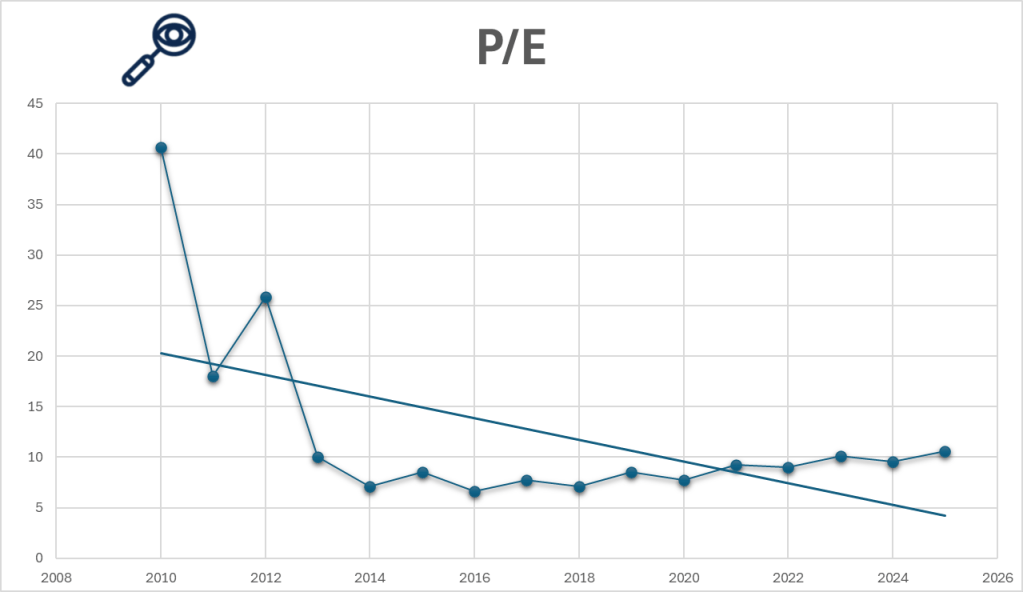
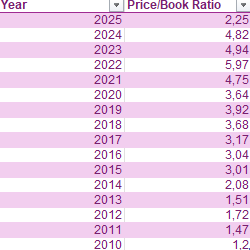
Price to Book ratio (P/B)
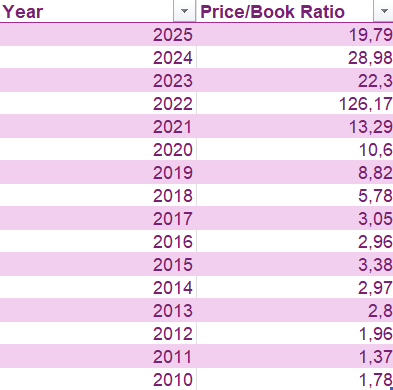
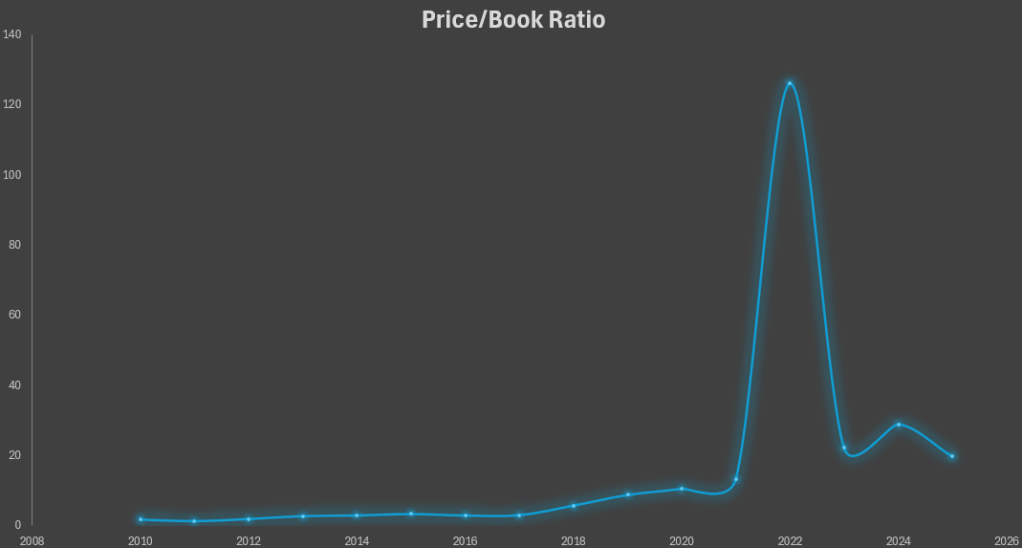
Illustration 22 and 23: PB ratio for Amgen from 2010 to 2025
Price-to-book value (P/B ratio) is a financial metric used to compare a company’s market value (its stock price) to its book value (the net asset value of the company, calculated as total assets minus total liabilities). The P/B ratio is calculated by dividing the current share price by the book value per share. A lower P/B ratio suggests that the stock may be undervalued, as investors are paying less for the company’s assets than their actual worth. Conversely, a high P/B ratiomay indicate that the stock is overvalued, or that investors expect high growth in the company’s future earnings. The P/B ratio is often used by value investors to assess whether a stock is trading at a fair price based on its underlying assets. Legendary Investor Warren Buffet prefers company’s with P/B lower than 1.5 and often buys around 1.3 or lower.
The price-to-book (P/B) ratio of Amgen has consistently traded at a relatively high P/B ratio, reflecting strong investor confidence in its future earnings power. In 2010, Amgen’s P/B ratio stood at around 1.78, already slightly above Warren Buffett’s preferred range of 1.3–1.5. Over the following years, it climbed further, reaching approximately 3.05 in 2015, before peaking at 126.17 in 2022. Even after moderating slightly, Amgen’s P/B remained elevated at 19.79 in 2024, far above levels considered attractive by traditional value investors.
This persistently high P/B ratio suggests that the market values Amgen primarily for its intellectual property, drug pipeline, and R&D potential rather than its tangible asset base. For conservative, asset-focused investors, such a valuation may be a red flag, signaling that the stock could be overvalued relative to book value. However, for growth-oriented investors, the premium reflects confidence in Amgen’s ability to sustain innovation, generate high margins, and capitalize on its biotechnology expertise. In short, Amgen’s P/B ratio does not signal a “hidden bargain” in the Buffett sense, but rather a market willing to pay a steep premium for its intangible strengths and future earnings potential.
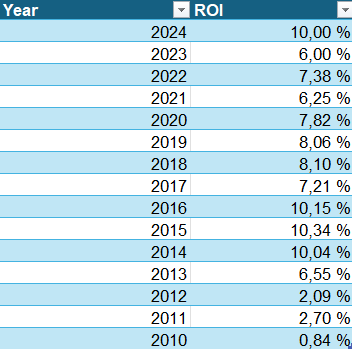
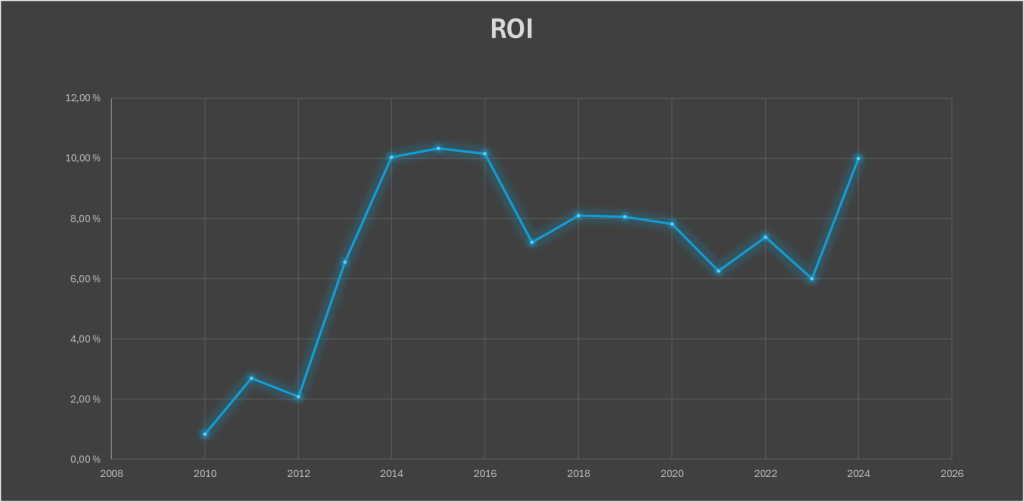
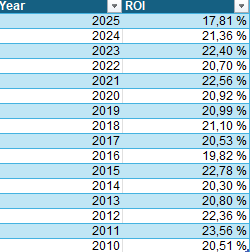
Return on Investment (ROI)
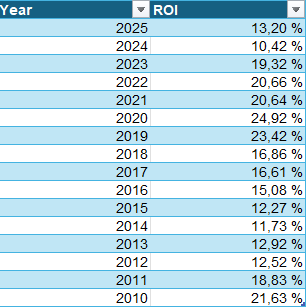
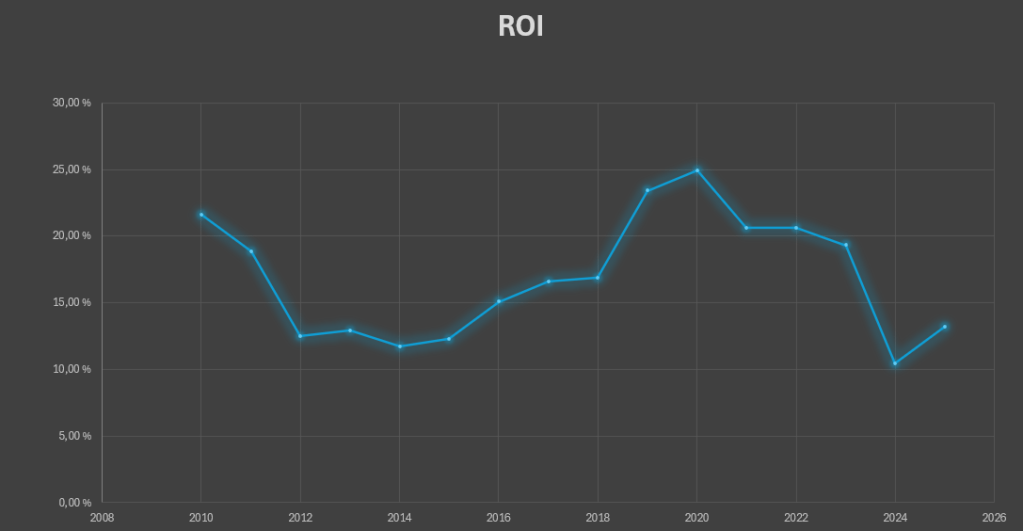
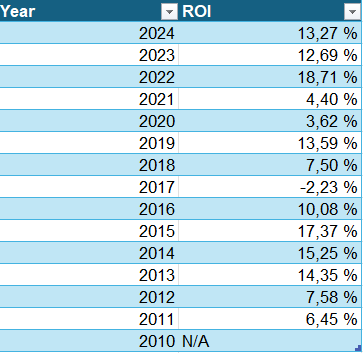
Illustration 24 and 25: ROI for Amgen from 2010 to 2024
For value investors, another essential metric when evaluating Amgen stock is Return on Investment (ROI), as it reveals how efficiently the company is using its capital to generate profits. In simple terms, ROI measures how much return a business earns relative to the capital invested to run it. Even if a company shows strong revenues, if it needs massive amounts of capital to produce modest profits, it may not be an attractive investment. For example, if one company generates a $100,000 return on a $1 million investment, while another earns the same return on just $500,000, the latter is clearly more efficient and potentially more valuable. ROI helps investors identify these distinctions and avoid companies that consume capital without delivering proportional returns. The higher the ROI, the better but it is also very industry dependent as some industries need a lot more capital than others. Legendary investor Warren Buffett has often stated that he seeks returns of at least 15% annually on his investments over time. While he doesn’t quote ROI specifically, this is effectively what he aims for in terms of return on invested capital and intrinsic value growth.
Amgen has historically delivered a relatively strong Return on Investment (ROI), reflecting the capital-light nature of the biotechnology sector compared to asset-heavy industries like automotive. In 2010, Amgen’s ROI stood at approximately 21.63%, already well above the averages seen in more capital-intensive businesses. Over the following years, ROI fluctuated but generally trended upward, reaching 15.08% in 2016 and peaking at around 24.92% in 2020, comfortably within the range Warren Buffett often cites as desirable for long-term investments. However, this efficiency has not been fully consistent, Amgen’s ROI fell to 10.42% in 2024, before recovering modestly to 13.2% in 2025.
These shifts highlight both the strength and the vulnerability of Amgen’s business model. On one hand, the company demonstrates the ability to generate high returns on invested capital when its drug pipeline performs strongly, underscoring its competitive advantage in biotechnology. On the other hand, the recent decline signals the risks tied to patent expirations, R&D costs, and the volatility of drug approvals. For investors, Amgen’s ROI profile is a mixed but still compelling signal: while not always meeting Buffett’s ideal threshold, it frequently approaches or exceeds it, showing that the company has the potential to deliver strong long-term value when it manages its capital efficiently.
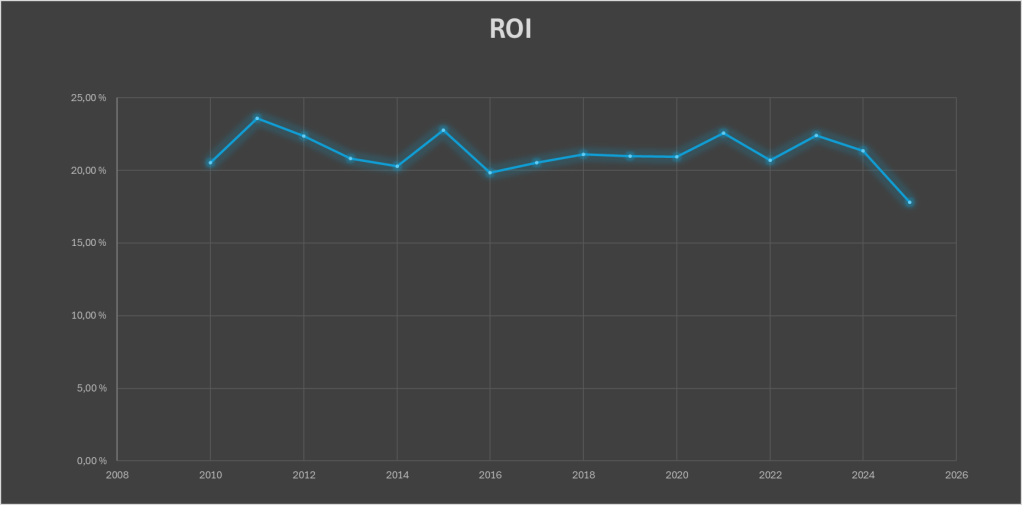
Dividend

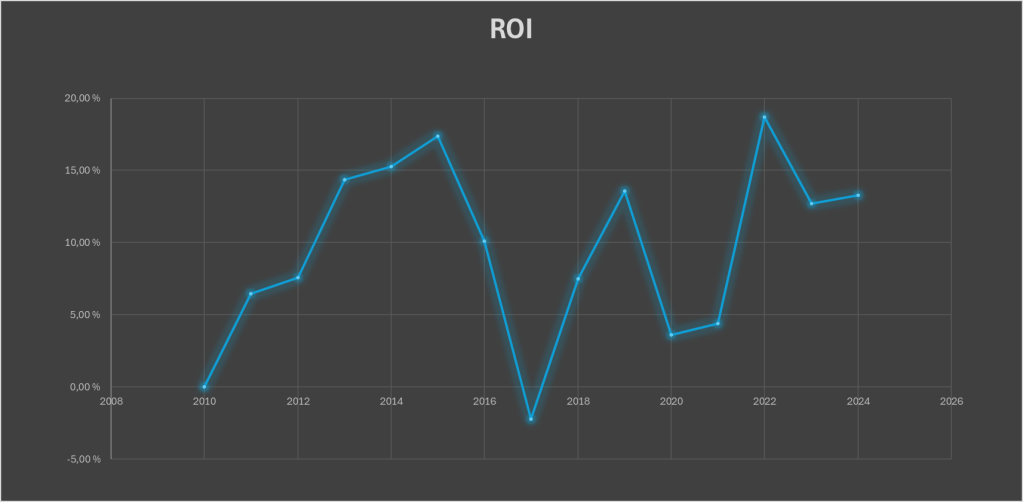
Illustration 26: Dividend yield and dividend payout ratio for Amgen from 2014 to 2024.
Amgen has built a reputation as a consistent dividend payer in the biotechnology sector, a rarity in an industry where many peers reinvest heavily without returning capital to shareholders. In 2009, Amgen paid an annual dividend of USD 0.56 per share, but since then, its payouts have grown substantially, reaching USD 8.53 per share in 2024. This reflects a remarkable compound annual growth rate in dividends, underscoring the company’s strong cash generation capacity and long-term commitment to shareholder returns. At the 2024 level, Amgen’s dividend yield stood at around 3.2%, comfortably above the average for the broader pharmaceutical and biotech sector, which typically ranges between 1.5% and 2.5%.
This steady and growing dividend stream highlights Amgen’s maturity as a company and its ability to balance rewarding shareholders with funding an active R&D pipeline. However, there are risks: Amgen’s high debt levels and declining equity base (as discussed earlier) could constrain its ability to sustain aggressive dividend growth in the long run. Moreover, as its drug portfolio faces patent expirations, the company will need to rely on pipeline success and acquisitions to protect earnings and, by extension, dividend stability.
Overall, Amgen’s dividend history is a green flag for income-seeking investors, as it provides reliable and above-average yields in an industry where dividends are not always guaranteed. That said, the company’s elevated leverage and future capital needs pose risks that cannot be ignored. For conservative, long-term investors, the dividends are attractive, but they should be weighed against the balance sheet pressures and reliance on future drug pipeline performance.
Insider Trading
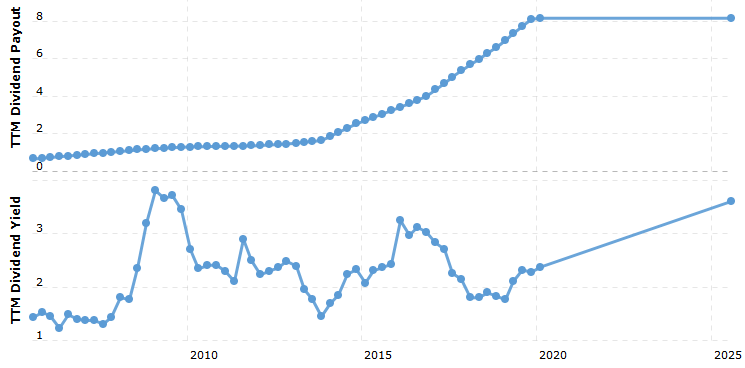
Over the past year, insider trading activity at Amgen has been dominated by sales rather than purchases, with several senior executives reducing their holdings. For instance, Jonathan P. Graham, Amgen’s Executive Vice President and General Counsel, sold about 25,045 shares worth roughly $7.3 million. David M. Reese, Executive Vice President and Chief Technology Officer, executed multiple sales, including a transaction of 25,225 shares valued at around $7.7 million, as well as an additional sale of 8,711 shares. Murdo Gordon, Executive Vice President of Global Commercial Operations, sold approximately 8,771 shares for $2.6 million, while Nancy A. Grygiel, Senior Vice President and Chief Compliance Officer, sold about 1,589 shares for nearly $484,000. More recently, Senior Vice President Rachna Khosla sold 1,500 shares valued at $434,000.
In total, insider sales over the past twelve months are estimated at around $12 million, with no notable insider purchases reported during the same period. Insider ownership at Amgen remains very small, less than 1% of total outstanding shares, indicating that management’s direct equity exposure to the company’s stock performance is limited.
From an investor’s perspective, this trend leans toward a red flag. While insider selling does not always signal a lack of confidence. executives often sell shares to diversify portfolios or cover tax obligations, the absence of insider buying is noteworthy. If insiders viewed Amgen’s stock as undervalued, one would expect at least some buying activity. The consistent pattern of large, multi-million-dollar sales by multiple executives suggests that insiders believe the stock is fairly valued or that near-term upside may be limited.
That said, these sales should be interpreted in context. Amgen remains a financially strong biotechnology company with a robust drug pipeline and solid cash generation, and there is no indication of distress or panic selling. For long-term investors, insider selling may not necessarily undermine the company’s fundamentals, but the lack of buying activity is a cautionary sign that should not be ignored.
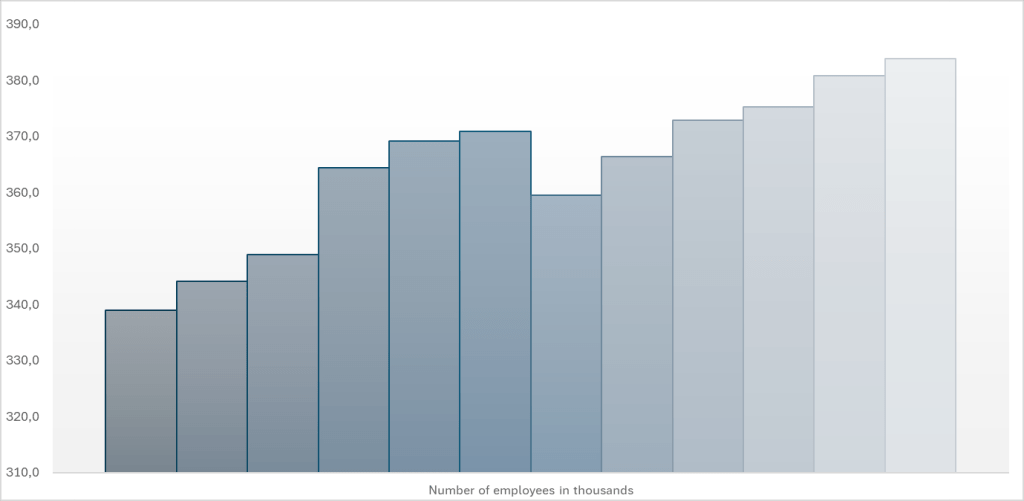
Other Company Info
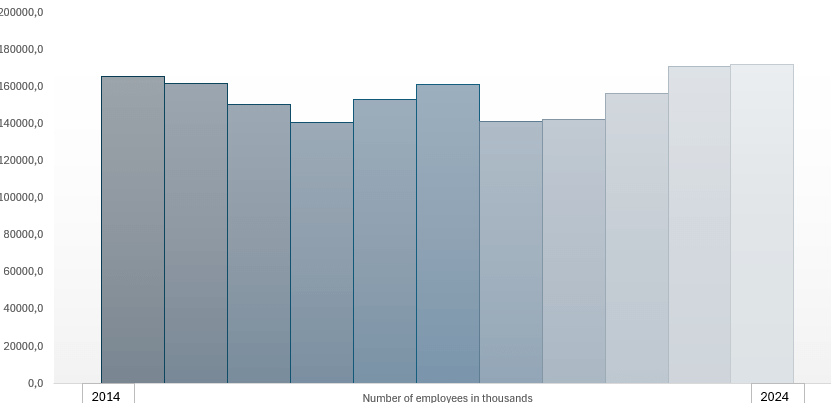
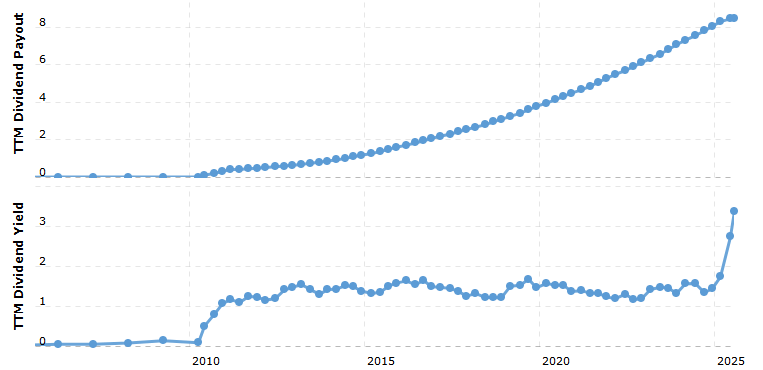
Founded in 1980, Amgen Inc. is a leading American multinational biopharmaceutical company headquartered in Thousand Oaks, California. As of 2024, the company employs approximately 28,000 people globally, reflecting its extensive operations in biotechnology research, development, manufacturing, and commercialization of human therapeutics. Amgen is publicly traded on the NASDAQ under the ticker symbol AMGN and operates within the Healthcare sector, specifically in the Biotechnology industry.
Amgen Inc.’s corporate headquarters is located at One Amgen Center Drive, Thousand Oaks, CA 91320-1799, United States. As of September 19, 2025, Amgen’s market capitalization is approximately $153.65 billion USD. The company maintains a diverse portfolio of roughly 40 products across four therapeutic areas: General Medicine, Rare Disease, Inflammation, and Oncology. For more information, visit Amgen’s official website: https://www.amgen.com.


Illustration 27-29: Location and number of employees of Amgen.
Final Verdict
Amgen Inc. presents a mixed picture for long-term investors. On the positive side, the company has a strong track record of revenue growth, robust free cash flow, and a history of steadily increasing dividends, making it attractive for income-focused investors. Its diverse product portfolio across General Medicine, Rare Disease, Inflammation, and Oncology provides stability and resilience in a volatile biotechnology market.
However, Amgen’s heavy debt load is a significant concern. With long-term liabilities far exceeding cash on hand and a high debt-to-equity ratio, the company’s financial leverage raises questions about its ability to navigate downturns or unexpected challenges without compromising growth or dividends. This elevated debt adds a layer of risk that cannot be ignored, especially for investors seeking safer, lower-risk investments. Furthermore, the price ratioes suggest that it is not undervalued and is as such not a good choose for value investors.
While Amgen’s strong pipeline and consistent cash generation offer upside, its high leverage makes it a riskier bet compared to peers with more conservative balance sheets. Long-term investors should weigh the potential rewards against the substantial financial risk posed by its indebtedness.


.JPG)


.jpg)


:max_bytes(150000):strip_icc()/closeup-of-big-gold-nugget-511603038-5ad92a97fa6bcc00362b919b.jpg)