Introduction – Born with Nothing but Fire in his belly
It all began in 1956 in the heart of horse country, Lexington, Kentucky. Picture a small home, chipped paint, a cracked driveway, and a fridge that was more often empty than full. This was the world John Bryan Morgan was born into. His childhood wasn’t bathed in luxury. No designer clothes, no trust funds, no summer getaways to Europe. What he had instead was a relentless fire in his belly, a hunger for something bigger.
Illustration1: John Morgan, the legend behind it all.
John was one of five siblings in a working-class family that often struggled to make ends meet. His father, a meat cutter with a troubled relationship with alcohol, would sometimes disappear into his vices, leaving his wife, John’s mother, to keep the family afloat. She was the real-life Wonder Woman. No cape. No superpowers. Just grit and an unbreakable sense of duty.
Even as a child, John knew life wasn’t fair. Other kids had allowances. He had chores. While others played video games, he was mowing lawns, washing dishes and hustling in every way he could.
And yet, even amid poverty, there was something special about young John. He was observant, sharp and most importantly, he had a dream. He wasn’t sure what it was yet, but he knew it didn’t involve staying poor.
Illustration 2: Kentucky, the humble start of John Morgan
College Dreams and Detours
John was determined to break the cycle. He knew education was the key, the great equalizer. He managed to claw his way into the University of Florida, a major leap for a kid from the working-class South. But college wasn’t a picnic. It was a battlefield.
To afford tuition, John worked a series of odd jobs, from dishwashing to nighttime security. He studied by the dim glow of streetlamps. He skipped meals. He bought used textbooks with notes scribbled all over them. But he never complained. Not once. Because he was building his future, one late-night cram session at a time.
After undergrad, John set his sights on law school. He got into the University of Florida Levin College of Law, where he was surrounded by peers from elite families, meaning kids who rolled up in BMWs while he was still patching holes in his shoes. But he didn’t care. He wasn’t there to impress, he was there to dominate.
He graduated in 1983, not just with a degree, but with a vision. He didn’t want to work for the rich. He wanted to fight for the people who had no voice, people like his mom, like his friends back in Kentucky, like himself.
Illustration 3: Morgan didn’t let the fact that he wasn’t rich or his social status bring him down.
The Birth of a Giant: Morgan & Morgan
In 1988, John Morgan did something insane, he left the comfort of an established firm and started his own with barely a handful of clients and next to no money.
He and his wife Ultima, a fellow lawyer, worked from a tiny office in Orlando, scraping together clients and praying they could make rent. There was no glitz, no glam, no waiting list of millionaire clients. It was just John, Ultima, a desk, a phone and a dream. But John had something most lawyers didn’t, the courage to advertise.
Back then, legal advertising was frowned upon. It was seen as “low-brow” even tacky. But John saw the future. He started running commercials, putting up billboards and buying ad spots on radio and TV. It was revolutionary. His face became instantly recognizable. His firm’s phone began to ring off the hook. And slowly but surely, Morgan & Morgan became a name people trusted.
Traditional firms sneered. Some even mocked him openly. But guess what? It worked. The phone lines lit up. Working-class Americans, immigrants, single mothers, veterans and everyday folks finally saw a lawyer who seemed to get them, a lawyer who didn’t look down on them, but stood beside them.
John knew that justice shouldn’t be reserved for the rich. He created a firm that operated on contingency meaning clients paid nothing unless the firm won. This flipped the power dynamic of law on its head. Suddenly, people who could never afford an attorney were getting high-powered representation. And they were winning.
Illustration 4: John Morgan’s formula of success lies in his use of advertisement.
Word spread. Morgan & Morgan began adding attorneys. Then offices. Then entire teams dedicated to intake, investigations, case management and trial. The small Orlando firm morphed into a regional force, then a national powerhouse.
But the firm wasn’t just growing, it was innovating. John implemented cutting-edge call centers and custom legal software to manage thousands of cases simultaneously. He invested in digital ads and SEO when other firms were barely online. He brought in experts in analytics, data and marketing to scale the business like a Silicon Valley startup.
By the 2000s, Morgan & Morgan had become a juggernaut. John kept his foot on the gas, opening offices in nearly every major city. The firm handled cases involving everything from medical malpractice and product liability to class actions and even civil rights.
Today, Morgan & Morgan has over 800 attorneys and 3,000 staff members. It serves clients in all 50 states and handles more than half a million cases each year. It’s not just the largest injury law firm in America, it’s one of the most recognized legal brands in the world.
Illustration 5: Morgan & Morgan has now more than 800 attorneys and run ads nationwide not only in Orlando where it all started.
John Morgan didn’t just start a law firm. He built a legal empire with a mission so clear it’s tattooed on the American psyche: “For The People.”
And that empire? It all started in a tiny Orlando office, with a man who believed that no one should have to fight alone.
From the Courtroom to the Boardroom
John Morgan didn’t just want to win cases, he wanted to bend the entire legal universe to his will.
Picture this: most lawyers were grinding away on measly slip-and-fall cases, chasing billable hours like hamsters on a wheel. John? He was building an empire. While the rest of the legal world was stuck in the 1980s, he was already thinking like Jeff Bezos with a briefcase.
He turned his firm into a litigation factory, but not in a sleazy ambulance-chaser way this was industrial-strength lawyering. Car accidents? Handled. Medical malpractice? Crushed. Class-action lawsuits? Bring it on. If David had a case against Goliath, Morgan & Morgan would’ve filed it before sunrise.
He pioneered a flat-fee structure, built a literal in-house call center to handle thousands of daily inquiries, and invested in tech like he was the Mark Zuckerberg of lawsuits. Imagine Apple HQ, but instead of iPhones, they were cranking out million-dollar verdicts.
Soon, he was on the talk-show circuit, dishing out unfiltered wisdom. He wrote books that didn’t just sit on dusty law school shelves, they hit bestseller lists.
His book “You Can’t Teach Hungry” was part pep talk, part street-fight manual, and part “Morgan gospel.” The thesis was simple: hustle like hell, be unapologetically yourself and never forget who you’re fighting for.
The Man behind the money
Now, you’d think a billionaire lawyer would be a stiff in a tailored Armani suit, sipping a $500 Scotch in some mahogany-lined office. Not John.
Illustration 6: Morgan was never stiff or elitist like other lawter, but he was relatable and liked the same things as an average american like a good Cuban sandwitch.
The man loves fried chicken. He loves Cuban sandwiches so much he’s practically a sandwich influencer. He puffs cigars like he’s starring in his own gangster flick, and he tweets jokes that make you wonder if your lawyer is secretly running a comedy club on the side.
He’s approachable, funny, and dare I say it dangerously relatable. And that’s why people adore him.
But peel back the jokes, and you find someone who cares deeply. Morgan has donated millions to causes like education, poverty relief, and criminal justice reform. One of his fiercest crusades? Medical marijuana.
This wasn’t about trend-chasing or headlines. This was personal. His brother, Tim, suffered from a devastating spinal cord injury, and medical marijuana was the only thing that gave him relief. John didn’t just sympathize, he fought. He poured millions into Florida’s 2016 Amendment 2 campaign and helped legalize medical marijuana statewide.
Not because it was fashionable. Not because it was profitable. But because it was right. Because family came first
The Billionaire Nobody Saw Coming
John Morgan didn’t wake up one day and say, “I want to be a billionaire.” He just kept building, winning, investing and suddenly, there it was.
Hotels? He bought them. Real estate? He stacked it like Monopoly pieces. Cannabis startups? Yep, he planted those seeds too. By the time anyone noticed, John had quietly become the billionaire nobody expected.
Sure, he’s got the toys: a mansion in Lake Mary, Florida, that looks like something out of MTV Cribs.
A fleet of cars. A private jet. A yacht. Probably a secret lair under the mansion for good measure.
But here’s the kicker: he’s still the same fried-chicken-loving, Cuban-sandwich-tweeting, people’s lawyer he always was. If you ask him about his proudest achievement, he won’t say “the billions.” He’ll say it’s his employees who love him, the thousands of clients whose lives he helped rebuild, and the fact that when people hear the name “Morgan,” they think trust.
Illustration 7: Morgan didn’t let his money change who he was.
The Media Mogul and the Meme Machine
Advertising? John Morgan doesn’t just do it, he dominates it. His law firm commercials are the stuff of legend. Funny, bold, slightly absurd and absolutely unforgettable.
And then there’s social media. Most billionaires hire a PR team to write robotic posts. John Morgan? He’s tweeting his own jokes, ranting about insurance companies, and casually dropping lines about running for president. One day he’s a lawyer. The next? A meme.
But here’s the genius: he leaned into it. He became the meme. He is the meme. He understood what most tycoons don’t: in the modern world, authenticity beats polish. Every time.
Illustration 8: John Morgan used memes, tweets and advertising heavly to his advantage.
For the People
Everything John Morgan built, everything, comes back to one mantra: For The People.
It’s not just a slogan slapped on a billboard. It’s the heartbeat of his firm. Today, Morgan & Morgan handles over 500,000 cases a year, a mind-boggling number that makes them less of a law firm and more of a justice delivery system.
He mentors young lawyers, invests in progressive causes and keeps pushing the boundaries of what a law firm can do. His sons are stepping into the game, learning the ropes, gearing up to take the Morgan legacy even further.
And John? He’s not even close to done. He might run for office. He might launch a bourbon brand called “For the Pour.” He might buy a baseball team just for the fun of it. Whatever it is, you can bet it’ll be big, bold, hilarious and very, very John Morgan.
Final Thoughts: The Legend of John Morgan
From the dirt roads of Kentucky to billion-dollar boardrooms, John Morgan’s story is the ultimate “American dream with a punchline.”
He didn’t just beat the odds, he rewrote them. He showed us that grit, guts and a sense of humor can take you from nothing to an empire.
He started with nothing. He gave everything. And he built a kingdom, for the people.
And if you don’t believe me, just wait because the next chapter of John Morgan’s story is probably going to be wilder than the last.
Illustration 9: John Morgan knew the power of humor and advertising.
India is more than just a country, it is a civilization that spans thousands of years, a vibrant continent in its own right, and an economic marvel constantly in motion. With a history that stretches back over five millennia, India remains one of the world’s oldest cultures while simultaneously being one of the youngest and fastest-growing economies on the planet.
Today, it stands as the most populous nation on Earth, the fifth-largest economy by nominal GDP, and a powerhouse of innovation and entrepreneurship. The economy of India is a developing mixed economy with a notable public sector in strategic sectors.
Known as the world’s largest democracy, India is a federal republic composed of 28 states and 8 union territories. It is a nuclear-armed nation, a member of influential groups such as the G20, BRICS, and the World Trade Organization, and holds a pivotal position in the Indo-Pacific region both strategically and economically.
As of 2024, India’s nominal GDP reached nearly $3.9 trillion, edging past the United Kingdom and approaching the size of Germany’s economy. When measured in purchasing power parity terms, India ranks third globally behind China and the United States. This remarkable economic ascent is fueled by a young and expanding population of 1.44 billion people, a rapidly growing middle class, and a labor force increasingly skilled in technology and services.
his article explores the complex and fascinating story of India’s economic evolution, from its early days of immense wealth through the hardships of colonialism, the challenges of socialist policies, and finally the remarkable liberalization that catapulted the nation into the global spotlight. Whether you are an investor, student, or simply curious about global affairs, India’s economic journey offers profound lessons in resilience, ambition, and transformation.
Historical Background
India’s history as an economic power dates back thousands of years, when it accounted for roughly a quarter to a third of the world’s GDP. During ancient times, great empires such as the Mauryas, Guptas, Cholas, and later the Mughals presided over prosperous kingdoms that exported textiles, spices, gems, and rich cultural knowledge to distant lands. India’s early economy was sophisticated and globally connected, making it one of the wealthiest regions on Earth.
India’s history as an economic power dates back thousands of years, when it accounted for roughly a quarter to a third of the world’s GDP. During ancient times, great empires such as the Mauryas, Guptas, Cholas, and later the Mughals presided over prosperous kingdoms that exported textiles, spices, gems, and rich cultural knowledge to distant lands. India’s early economy was sophisticated and globally connected, making it one of the wealthiest regions on Earth.
Illustration 2: Mughal Empire of India
However, the arrival of European colonial powers, especially the British East India Company in the 18th century, marked a profound shift. What was once a manufacturing and trading powerhouse became a supplier of raw materials and a captive market for British goods.
The colonial period saw the systematic deindustrialization of India’s traditional industries, such as the famous textile mills of Bengal, and the extraction of wealth that hindered economic progress for nearly two centuries. By the time India gained independence in 1947, its share of the global economy had dwindled to a mere 3%, a shadow of its former glory.
Illustration 3: British India led to India falling from making up 22.6% of the world economy in 1700 to 3.8% in 1952.
After independence, India embarked on a path shaped by the vision of Prime Minister Jawaharlal Nehru, who championed a socialist-inspired model of economic development. The state took control of key industries such as heavy manufacturing, banking, railways, and energy.
While this helped establish a basic industrial base, it also resulted in the notorious “License Raj,” a cumbersome system of permits and bureaucratic controls that stifled entrepreneurship and economic dynamism. For decades, India’s growth rate lingered at a modest 3 to 4 percent, a pace so slow it was mockingly dubbed the “Hindu rate of growth.
The turning point came in 1991 when a severe balance of payments crisis forced India to fundamentally rethink its economic model. Led by Finance Minister Manmohan Singh, the government embarked on sweeping reforms that dismantled import restrictions, reduced subsidies, and opened the economy to foreign investment. This liberalization unleashed a wave of economic activity that transformed India into a global player. The IT sector boomed, telecom networks expanded, pharmaceutical companies grew to global prominence, and financial markets developed rapidly. India’s economy accelerated, foreign reserves surged, and the nation gained credibility on the world stage.
The Structure of the Indian Economy
India’s economy is broadly divided into three main sectors: agriculture, industry, and services. Together, these sectors weave a complex and sometimes contradictory tapestry. While agriculture still employs the largest share of the workforce, roughly 43% of the population, it accounts for only about 20% of GDP.
Illustration 4: The Indian economy is complex like a tapestry
Industry contributes around a quarter of the GDP and employs about a quarter of the labor force. The services sector dominates the economy, representing more than half of the country’s GDP, yet employs only about a third of the workers. This structural imbalance highlights some of India’s greatest development challenges but also points to immense opportunities for growth and modernization.’
1. Industry and Manufacturing
Historically a late bloomer in manufacturing, India has increasingly turned its attention to industrial development. The government’s flagship initiative, “Make in India,” aims to expand the manufacturing sector’s share of GDP to 25 percent.
he automobile sector is one of the largest in the world, with companies like Tata Motors, Mahindra & Mahindra, bajaj auto, TVS motor company, Atul Auto and Maruti Suzuki producing millions of vehicles annually. As of 2023, India ranked as the fourth-largest automobile producer in the world, following China, United States and Japan. T
he sector accounts for approximately 7.1% of India’s GDP and employs over 37 million people directly and indirectly. As of April 2022, India’s auto industry is worth more than US$100 billion and accounts for 8% of the country’s total exports and 7.1% of India’s GDP.
Illustration 5: India is one of the world’s largest producers of tuk tuks
The pharmaceutical industry, often called the “pharmacy of the world,” manufactures 60 percent of the world’s vaccines and is a global leader in generic drugs. Heavy industries such as steel, cement, and chemicals are dominated by conglomerates like Tata Steel and Aditya Birla Group.
India is also carving a niche in emerging industries such as semiconductors, solar energy equipment, and electric vehicles, with states like Gujarat and Tamil Nadu competing fiercely to attract large factories and investment. Defense manufacturing is another growing priority, as India seeks to reduce its dependence on arms imports and develop indigenous capabilities.
Mining contributed to 1.75% of GDP and employed directly or indirectly 11 million people in 2021. India’s mining industry was the fourth-largest producer of minerals in the world by volume, and eighth-largest producer by value in 2009.
In output-value basis, India was one of the five largest producers of mica, chromite, coal, lignite, iron ore, bauxite, barite, zinc and manganese; while being one of the ten largest global producers of many other minerals.
Illustration 6: Rajesthan is one of the indian states with the most natural resources
Indian cement industry is the 2nd largest cement producing country in the world, next only to China. At present, the Installed Capacity of Cement in India is 500 MTPA with production of 298 million tonnes per annum. Majority of the cement plants installed capacity (about 35%) is located in the states of south India.
India surpassed Japan as the second largest steel producer in January 2019.The country’s steel sector benefits from abundant iron ore reserves, a large labor force, and strong government support through initiatives like “Make in India” and the National Steel Policy. As demand for steel rises both domestically and globally, India continues to expand its production capacity and export footprint.
Petroleum products and chemicals are a major contributor to India’s industrial GDP, and together they contribute over 34% of its export earnings. India hosts many oil refinery and petrochemical operations developed with help of Soviet technology such as Barauni Refinery and Gujarat Refinery, it also includes the world’s largest refinery complex in Jamnagar that processes 1.24 million barrels of crude per day.
By volume, the Indian chemical industry was the third-largest producer in Asia, and contributed 5% of the country’s GDP. India is one of the five-largest producers of agrochemicals, polymers and plastics, dyes and various organic and inorganic chemicals. Despite being a large producer and exporter, India is a net importer of chemicals due to domestic demands. India’s chemical industry is extremely diversified and estimated at $178 billion.
India is one of the largest producers and consumers of chemicals and fertilizers in the world, with the chemical industry contributing over 7% to the country’s GDP and ranking 6th globally in chemical production. At present, 57 large fertilizer units are manufacturing a wide number of nitrogen fertilizers. These include 29 urea-producing units and 9 ammonia sulfate-producing units as a by-product. Besides, there are 64 small-scale producing units of single super phosphate.
The fertilizer sector, vital for India’s agriculture, produced around 43.7 million tonnes of fertilizers in 2024–25, including urea, DAP, and complex fertilizers, supported by government subsidies and increasing adoption of nutrient-based fertilizers. The growing demand from agriculture, textiles, and pharmaceuticals continues to drive expansion in both sectors.
Illustration 7: India is one of the largest producers of dye in the world.
Furthermore, when it comes to transportation India is the third-largest domestic aviation market in the world, with passenger traffic reaching over 280 million in 2023. As of 2024, the country has 149 operational airports, up from 74 in 2014, and the government plans to expand this to 220 airports by 2030 under a 1 trillion Indian rupees infrastructure push.
India’s railways, contributing about 2% to the country’s GDP, transport over 8 billion passengers and 1.2 billion tonnes of freight annually, making it one of the world’s largest and busiest rail networks. The sector supports around 7 million jobs, both directly and indirectly, playing a crucial role in driving economic growth and connecting markets across the nation. With ongoing investments in modernization, electrification, and high-speed rail, Indian Railways is set to boost productivity and sustainability even further.
Illustration 8: Mumbai train station
India also has multiple ship building companies such as Cochin Shipyard, Hindustan Shipyard and Swan Defence and Heavy Industries, mainly produces ships for European, South American and African shipping companies. Cochin shipyard is the pioneer in autonomous electric propulsion ships.
2. Agriculture – The Paradox of Inida’s economy
Agriculture remains the cornerstone of India’s socio-economic landscape, deeply intertwined with the lives of over 40% of the population who depend on it for their livelihoods. Despite its declining share of around 16-17% in the country’s GDP, the sector is critical for ensuring food security, sustaining rural communities, and maintaining social stability across vast regions.
India proudly holds the title as the world’s largest producer of milk, pulses, and spices, and is among the top global producers of staples like rice, wheat, sugarcane, cotton, and a wide variety of fruits and vegetables, feeding over 1.4 billion people.
Yet, beneath this agricultural abundance lies a paradox: low productivity and fragmented landholdings often limit farmers’ incomes and economic resilience. Most farms are small, averaging less than 2 hectares, which constrains the adoption of advanced technology and efficient farming practices.
Additionally, frequent climate shocks, such as droughts, floods, and erratic monsoons, leave millions vulnerable and threaten crop yields year after year. Infrastructure challenges, including inadequate irrigation, poor storage facilities, and inefficient supply chains, further reduce farmers’ ability to maximize profits and reach larger markets.
Illustration 9: India is one of the largest producers of tea
Recognizing these challenges, India has embarked on a path to modernize agriculture by investing in better irrigation systems, promoting mechanization, improving rural roads and cold storage, and embracing digital technologies like satellite imaging and mobile apps to provide real-time information to farmers.
India’s agriculture and allied sectors remain a vital part of the economy, accounting for 18.4% of GDP and employing nearly 46% of the workforce, despite the sector’s shrinking share in overall economic output, from 52% in 1951 to around 15% in 2023.
The country boasts the largest arable land area in the world, ranking as a top global producer of milk, pulses, spices, rice, wheat, sugarcane, cotton, fruits, and vegetables. However, productivity challenges persist, with yields often only 30% to 50% of global best practices due to small landholdings, inadequate irrigation (only about 39% of cultivated land is irrigated), and infrastructure gaps in storage, roads, and markets. These issues limit farmers’ incomes and keep agricultural output below its full potential.
India is also a global leader in fisheries and aquaculture, ranking 3rd and 2nd respectively, providing livelihoods to millions, and exporting significant quantities of processed products like cashew kernels and milk. While the country produces roughly 316 million tonnes of foodgrains annually, stagnation in output and large post-harvest losses, up to one-third of production, highlight inefficiencies.
Government initiatives like the ₹1.2 trillion Accelerated Irrigation Benefit Programme aim to improve irrigation and infrastructure, but regulatory hurdles and market constraints continue to slow progress. Overall, India’s agriculture sector is a complex blend of immense scale, rich diversity, and urgent need for modernization to boost productivity and farmer prosperity.
Illustration 10: Indian women pounding rice, India is one of the world’s largest rice producers
However, progress has been uneven and often slowed by political sensitivities and social complexities. The massive farmer protests of 2020–21 underscored the deep-rooted concerns and emotional ties surrounding land rights, pricing, and market reforms. These protests highlighted how any attempt to transform India’s agricultural sector must carefully balance economic modernization with the protection of farmers’ livelihoods and rights.
Looking ahead, the future of Indian agriculture depends on successfully navigating this delicate balance, integrating technology and innovation while ensuring inclusivity and sustainability. With targeted reforms, climate-resilient farming practices, and strengthened rural infrastructure, India has the potential not only to feed its vast population but also to emerge as a global leader in sustainable agriculture.
3. Services – The Crown Jewel
The services sector has emerged as the undisputed engine of India’s economic growth, contributing a staggering over 50% of the country’s GDP, making it the largest sector in the Indian economy. From IT and software exports to financial services, healthcare, education, telecommunications, tourism, logistics, and more. the breadth and dynamism of this sector reflect India’s transition from a primarily agrarian economy to a global services leader.
Illustration 11: The city of Hyderabad is becoming a global hub for IT.
Cities like Bengaluru, Hyderabad, Gurugram, and Pune have become world-renowned hubs for IT, software development, business process outsourcing (BPO), and innovation, attracting investments from global tech giants and startups alike.
India’s Information Technology and Business Process Management (IT-BPM) sector alone generated over $250 billion in revenue in 2023, employing more than 5 million professionals, and contributing significantly to foreign exchange earnings.
Indian IT firms serve clients across the globe, from Silicon Valley startups to Fortune 500 corporations, delivering everything from cloud computing to AI solutions. Beyond tech, India’s financial services sector, anchored by robust public and private banks, insurance companies, fintech startups, and stock exchanges like NSE and BSE, plays a pivotal role in capital formation and investor confidence.
India’s telecom sector is a global giant, now the second-largest market in the world with over 1 billion phone subscribers and one of the lowest call tariffs due to intense competition. In FY 2024, telecom equipment production crossed ₹45,000 crore, with exports hitting ₹10,500 crore, driven by the booming smartphone manufacturing industry. India also ranks among the top three globally in internet users, and is the largest DTH television market by subscribers making digital connectivity a key pillar of its economic growth.
Equally significant is the rise of tourism, healthcare, education, retail, e-commerce, and digital services, all of which are rapidly expanding with the growing urban middle class and increasing internet penetration. The Unified Payments Interface (UPI) revolutionized digital transactions, processing billions of transactions monthly, and helped formalize vast segments of the economy. Meanwhile, the services sector has also become a major employment generator, especially in urban and semi-urban areas, offering opportunities in both high-skilled and low-skilled segments.
The government’s focus on initiatives like Digital India, Skill India, and Start-Up India further accelerates the services sector’s potential, promoting entrepreneurship, digital infrastructure, and employment. However, to sustain this momentum, India must address key challenges, such as improving ease of doing business, upskilling the workforce, enhancing service exports, and bridging the digital divide in rural areas.
In essence, the services sector is not just a component of India’s economy, it is its beating heart, transforming the country into a knowledge-based, innovation-driven powerhouse that is well on its way to becoming a major player in the global economic landscape.
Innovation and the Digital Revolution
India’s 63 million MSMEs (Micro, Small, and Medium Enterprises) contribute 35% to GDP, employ over 111 million people, and make up 40% of exports, earning their title as the “growth engines” of the economy. Though 90% are micro-enterprises with limited scale, 2023 saw a record 179 SME IPOs, showing rising investor interest. With continued policy support and reforms, MSMEs hold the key to tackling unemployment and driving inclusive growth.
India’s digital transformation has been nothing short of revolutionary. Central to this has been the Unified Payments Interface (UPI), a real-time digital payment system that processes billions of transactions monthly, outpacing even the combined digital payments of the US, China, and the EU. The Aadhaar biometric identification system has provided over 1.3 billion Indians with a unique digital identity, enabling unprecedented access to banking, government services, and welfare programs.
Together with the Jan Dhan-Aadhaar-Mobile (JAM) trinity, these innovations have democratized access to finance and services across vast rural and urban populations. The government’s Digital India initiative aims to further embed technology into governance, business, and daily life, while targeted programs such as Startup India and the Semiconductor Mission are propelling innovation and domestic manufacturing.
Furthermore, India’s youthful population is one of its greatest assets. With a median age of just 28.4 years, India is far younger than many developed countries whose median ages often exceed 40. Each year, approximately twelve million young people enter the labor market, creating both an opportunity and a challenge to generate sufficient employment. By 2030, India is expected to be home to seven megacities and more than 600 million urban residents, fueling demand for housing, infrastructure, transportation, and services.
Illustration 12: India’s population is very young something that can become its great asset.
The key to harnessing this demographic dividend lies in education and skills training to ensure that young Indians are productive contributors to the economy rather than unemployed or underemployed.
India’s cultural richness and heritage form a vital pillar of its economy. The country attracted more than 17 million tourists in 2023, contributing significantly to local economies.
Beyond the traditional pilgrimage and heritage tourism sectors, India’s global influence is bolstered by Bollywood, yoga, cuisine, cricket, and festivals that resonate worldwide. The Indian diaspora, numbering over 30 million people globally, acts as a powerful cultural and economic bridge, enhancing India’s soft power and international reputation.
Illustration 13: A Bollywood poster
Trade and Global Integration
India’s role in global trade continues to expand rapidly. As the world’s ninth-largest exporter of goods and sixth-largest importer, India’s export basket includes refined petroleum, gems and jewelry, pharmaceuticals, automobiles and parts, and software services. The United States, China, the United Arab Emirates, the European Union, and ASEAN nations are India’s most significant trading partners.
India is actively negotiating free trade agreements with major economies like the UK and the EU and is building regional supply chains to reduce reliance on China and enhance economic resilience. On the global stage, India positions itself as a leading voice for the developing world, championing issues such as debt relief, food security, and climate action, especially during its G20 presidency in 2
Credit Score
India currently holds a sovereign credit rating of “BBB-” with a stable outlook from S&P and Fitch, and a “Baa3” from Moody’s, both of which are the lowest investment-grade ratings. These ratings indicate that India is a relatively safe destination for investment, but with moderate credit risk. The scores reflect a balance between India’s strong long-term growth prospects and structural economic challenges such as a high fiscal deficit, significant public debt, and dependency on imported energy.
The rating agencies acknowledge India’s resilient and diversified economy, large domestic market, improving infrastructure, and digital innovation as strengths. India’s track record of stable democratic governance, reforms in taxation (like GST), and emphasis on infrastructure and ease of doing business further support its rating. However, concerns remain over fiscal discipline, with the government debt-to-GDP ratio hovering around 83%, and recurring fiscal deficits above 5%, driven by subsidies, welfare schemes, and lower tax revenues.
Despite global economic uncertainties, India’s strong GDP growth, estimated at around 6–7% annually, even during volatile periods, continues to reinforce investor confidence. Many experts believe that with continued reforms, improved tax collection, and responsible fiscal management, India could see a credit upgrade in the coming years, which would lower borrowing costs and attract more foreign investment.
Challenges and contradictions
Despite its impressive rise, India faces deep-seated challenges. Income inequality is stark, with the richest one percent controlling more than 40% of the nation’s wealth. Structural issues such as unemployment. especially among youth and graduates, remain unresolved. While India has made strides in reducing corruption and improving ease of doing business, bureaucratic inertia and red tape still hinder many entrepreneurs.
Environmental problems loom large as well. Air pollution in cities frequently reaches hazardous levels, water scarcity threatens agriculture and urban centers, and climate change presents an existential risk to development gains. Public debt, while moderate compared to many developed nations, is rising and will require careful fiscal management.
Illustration 14: Ambani tower in India highlighting the difference between rich and poor in the country.
India’s Global Ambitions
Looking forward, India has set ambitious goals to become a $5 trillion economy by 2027 and to join the ranks of the world’s top three economic powers by 2050. The government’s vision of “Viksit Bharat,” or Developed India, aims for transformational progress by the centenary of independence in 2047.
Priority sectors include renewable energy, where India is already a global leader in solar power and has pledged to reach net-zero carbon emissions by 2070. Defense manufacturing, advanced technologies such as artificial intelligence and quantum computing, biotechnology, and infrastructure development are all central to India’s future growth plans.
Massive investments in freight corridors, expressways, and ports are underway to improve logistics and connect the vast country more efficiently.
Conclusion
India’s economy embodies a unique paradox. It is ancient and modern, fast-growing yet uneven, chaotic yet bursting with creative energy. Unlike the more streamlined and centralized economies of Germany or China, India’s democratic capitalism is messy and vibrant, shaped by millions of individual decisions, countless startups, and an energetic population.
Illustration 15: India is one of the fastest growing economies in the world.
Its rise is not just an economic story but a human one, about a nation harnessing its vast potential, striving to lift hundreds of millions out of poverty, and aiming to reshape the global economic order. As smartphones proliferate in small towns, solar panels spread across deserts, and coding campuses thrive in Bangalore and Hyderabad, India is writing a new chapter in the story of global growth.
India’s economy is a dynamic blend of traditional strength and modern innovation, driven by a powerful services sector, a vast and evolving agricultural base, and a rapidly growing industrial and manufacturing ecosystem. With a young population, expanding digital infrastructure, and consistent GDP growth averaging 6–7%, India is well-positioned to become one of the world’s leading economic powers. However, to fully unlock its potential, the country must address key challenges like unemployment, low agricultural productivity, infrastructure gaps, and fiscal discipline, while continuing to invest in reforms, technology, and human capital.
Canadian Solar Inc. is one of the largest and most established solar energy companies in the world. It has made significant contributions to the global transition toward renewable energy, specifically solar power. With a presence in over 20 countries, Canadian Solar has successfully integrated itself into both the manufacturing of solar photovoltaic (PV) products and the development of solar projects. In this article, we will explore the history, operations, competitive positioning, financials, the future prospects of Canadian Solar and of course make a comprehensive analysis of the stock of Canadian Solar.
History and Founding
Canadian Solar was founded in 2001 by Dr. Shawn Qu, a former University of Toronto researcher with a background in electrical engineering. Dr. Qu, originally from China, started the company in Ontario, Canada, with the goal of providing high-performance solar modules at competitive prices. The company’s initial focus was on manufacturing solar cells and modules, and its breakthrough came with its focus on high efficiency and the development of advanced technologies in the solar industry.
The decision to base the company in Canada was a strategic move, given the country’s growing interest in clean energy and environmental sustainability. However, Canadian Solar’s roots were international, as Dr. Qu leveraged relationships in China for access to affordable manufacturing resources. The company quickly expanded from its Canadian base and set up large-scale manufacturing operations in China, where it remains one of the leading solar module manufacturers today.
Canadian Solar’s commitment to innovation and sustainability has allowed it to grow from a small, niche manufacturer to a global leader in solar energy. The company’s products are now used in residential, commercial, and utility-scale solar projects around the world, making Canadian Solar a key player in the global energy transition.
Illustration 1: Canadian Solar logo with sun and rays symbolizing commitment to solar power.
Operations and Products
Canadian Solar operates in two major segments: Solar Module Manufacturing and Solar Power Projects.
Solar Module Manufacturing Canadian Solar produces a wide range of photovoltaic (PV) products, including solar modules, inverters, and energy storage systems. Their solar panels are among the most efficient on the market, with varying products designed for different types of consumers, ranging from residential to large-scale commercial and utility installations. The company uses advanced technology such as PERC (Passivated Emitter and Rear Cell) to ensure high efficiency and durability of their modules.
Solar Power Projects Beyond manufacturing, Canadian Solar is actively involved in the development, financing, and operation of solar power projects globally. This segment includes utility-scale solar farms, distributed solar energy systems for commercial and industrial clients, and energy storage solutions.
Canadian Solar has completed over 10 GW of solar projects worldwide, cementing its position as a leading solar energy provider. The company focuses on end-to-end solar solutions, offering customers everything from project development to system integration, operation, and maintenance.
In addition to these, Canadian Solar has made significant strides in the energy storage market. As the world shifts towards renewable energy, energy storage solutions are seen as a key enabler for balancing intermittent power generation from solar and wind energy. Canadian Solar’s energy storage division, which works in tandem with their solar projects, provides customers with grid-independent solutions that help store excess energy for later use.
Revenue Breakdown
The revenue breakdown of Canadian Solar is as follows:
1. Solar Module Manufacturing: This segment represents the largest portion of Canadian Solar’s revenue, contributing approximately 60-70%. The company’s solar modules are sold to both residential and commercial customers and are used in utility-scale projects. This portion of the business continues to grow as demand for solar energy increases globally, driven by favorable government policies, falling solar costs, and rising environmental concerns.
2. Solar Power Projects: The company’s solar power projects segment accounts for around 25-35% of its revenue. This portion includes the sale of solar power plants, as well as ongoing income generated from the operation of these plants. Over the years, Canadian Solar has managed to increase its share of revenue from projects, reflecting the growing demand for large-scale solar farms and distributed generation systems.
3. Energy Storage and Other Products: Although a smaller segment, energy storage systems and other ancillary products are becoming an increasingly important part of Canadian Solar’s portfolio. This segment contributes roughly 5-10% of the company’s total revenue.
Illustration 2: Energy Storage is quickly becoming a growing sector for Canadian Solar.
Canadian Solar has also been successful in managing costs and improving operational efficiency. The company’s gross margin has steadily improved due to its focus on high-efficiency products and scaling its manufacturing operations.
Key Competitors
Canadian Solar operates in a very highly competitive market. Its key competitors include:
First Solar (FSLR): A US-based solar energy company, First Solar is one of the leading manufacturers of thin-film solar modules. Unlike Canadian Solar, which primarily produces crystalline silicon modules, First Solar specializes in cadmium telluride (CdTe) technology. First Solar is known for its utility-scale solar projects, similar to Canadian Solar’s project development segment.
JinkoSolar (JKS): Another Chinese solar giant, JinkoSolar is one of the largest manufacturers of solar panels globally. JinkoSolar’s strength lies in its focus on technology, with an emphasis on increasing panel efficiency and reducing costs. The company’s global footprint is comparable to Canadian Solar’s, and its competitive pricing makes it a formidable rival.
Trina Solar (TSL): Trina Solar is another major Chinese player in the solar market. Like Canadian Solar, it operates in both module manufacturing and project development. Trina Solar has a strong presence in Europe, the Americas, and Asia.
LONGi Green Energy (601012.SS): LONGi is one of the largest manufacturers of monocrystalline silicon solar products. With a focus on technology and efficiency, LONGi competes directly with Canadian Solar in the module manufacturing market.
SunPower (SPWR): Based in the United States, SunPower is a major player in both residential and commercial solar installations. SunPower differentiates itself by offering premium solar products, while Canadian Solar offers a broader range of modules for different market segments.
To sum up, the solar power market is highly competitive with many competitors to challenge Canadian Solar.
Market Position and Competitive Advantages
Despite very high competion Canadian Solar holds a competitive edge in several areas:
Global Reach: With manufacturing facilities in China, Canada, and other parts of the world, Canadian Solar has a robust global supply chain and can cater to customers in diverse markets. Its presence in the Americas, Europe, and Asia ensures that it remains competitive in the global solar market.
Innovation and Technology: Canadian Solar places a strong emphasis on research and development (R&D). The company consistently strives to improve the efficiency and durability of its solar panels, which has helped it maintain its competitive edge. Canadian Solar is at the forefront of solar cell and panel technology, incorporating advanced technologies like PERC and bifacial modules.
Illustration 3: Canadian Solar’s is well known for being invested in research and development.
Cost Leadership: One of the key drivers behind Canadian Solar’s success is its ability to maintain a competitive price point while offering high-quality products. By leveraging economies of scale and low-cost manufacturing in China, Canadian Solar can keep its prices lower than many competitors while maintaining margins.
Comprehensive Solutions: Unlike some competitors that focus primarily on module manufacturing, Canadian Solar offers a comprehensive solution, including project development and energy storage. This ability to offer turnkey solutions, from manufacturing to operation and maintenance, is a significant advantage in attracting large-scale customers.
Future Outlook
Looking ahead, Canadian Solar is well-positioned to continue its growth. The global transition to renewable energy is accelerating, with solar energy at the forefront. The company’s strong brand, technological innovation, and global footprint provide a solid foundation for its future growth. Canadian Solar is also well-positioned to benefit from government incentives and policies aimed at promoting renewable energy adoption.
With increasing demand for solar energy, growing interest in energy storage, and continued advancements in panel technology, Canadian Solar is expected to remain a leader in the solar industry.
Furthermore, the company’s expansion into emerging markets like India, Africa, and Latin America presents significant growth opportunities.
Stock Analysis
In this section we will analyze Canadian Solar’s stock to see if it is a good stock to buy or not. Our philosophy is value investing meaning that we try to find good quality companies that are undervalued. However, we will give a holistic overview so all kind of investors with different philosophies can judge the stock for themselves.
Revenue and Profits
To determine a company’s worth and if it is worth investing in, the company’s revenue and profits are a natural starting point to analyze. It should never bee forgotten that a stock represents a company just like the small businesses in your home town. If someone asked you if you want to buy their company, the first question would naturally be how much the company makes and the same question when trying to analyze if a company registered in the stock exchange is worth buying.
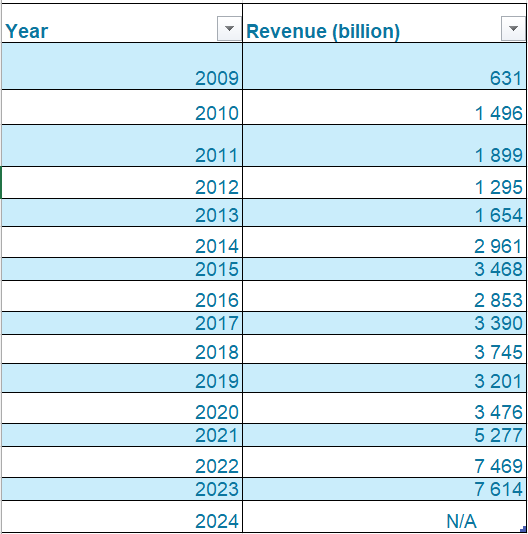
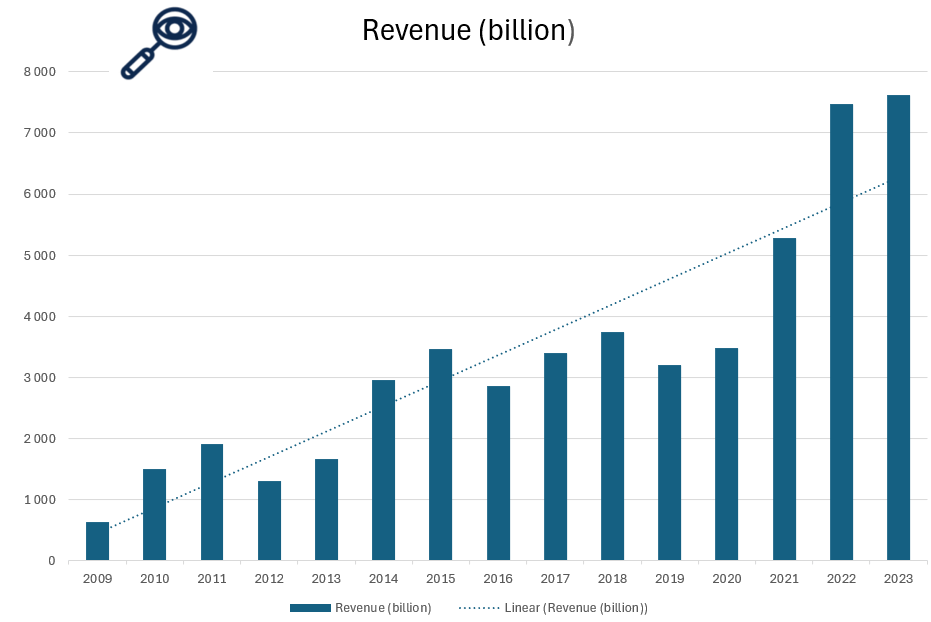
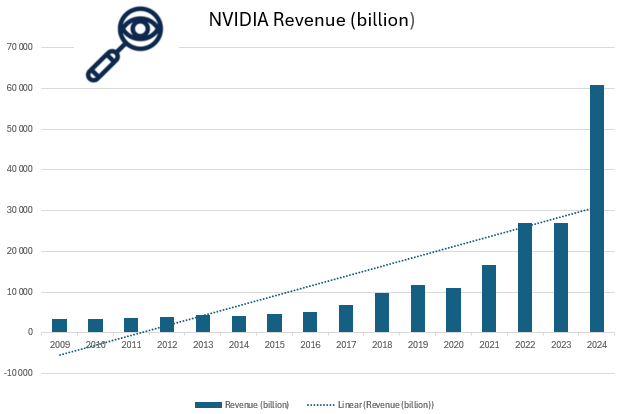
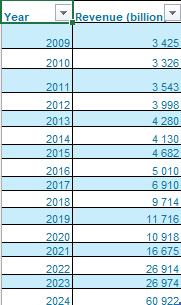
Illustration 4 and 5: Revenue of Canadian Solar from 2009 to 2023.
As seen in Illustrations 4 and 5, Canadian Solar’s revenue has been increasing over the long term, particularly in recent years. This growth is driven by rising global demand for solar energy, increased module shipments, and expansion into energy storage and project development. Additionally, favorable government policies and renewable energy commitments continue to fuel sales, positioning the company for sustained growth.
However, despite this overall upward trend, Canadian Solar’s revenue growth has been inconsistent. As shown in Illustrations 4 and 5, there have been years—such as 2012, 2016, and 2019—where revenue declined. This volatility is partly due to intense competition in the solar industry, fluctuating market conditions, and policy shifts affecting demand. For investors, this inconsistency raises concerns, as it suggests that Canadian Solar may not deliver steady revenue growth year after year, making it a potentially riskier investment compared to companies with more predictable financial performance.
Even though revenue growth has been inconsistent, the long-term trend remains upward. Considering the rising global demand for energy, the increasing popularity of solar power, and the momentum of the green energy transition, Canadian Solar is well-positioned for future growth. These factors, combined with the company’s expanding product offerings and global presence, suggest a promising outlook despite short-term volatility.
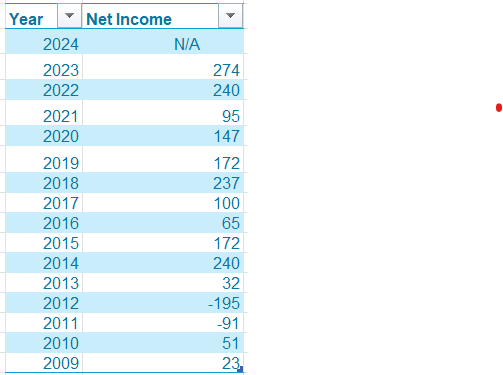
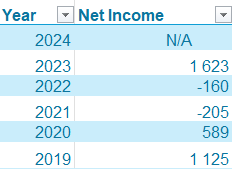
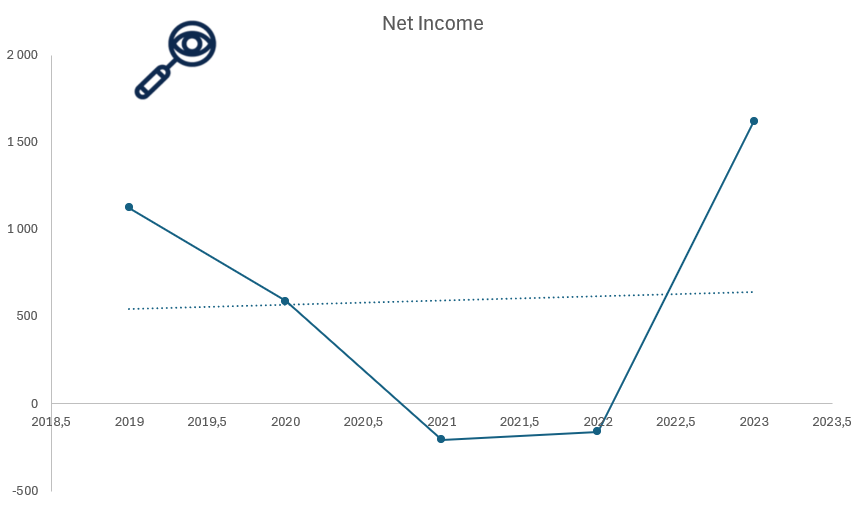
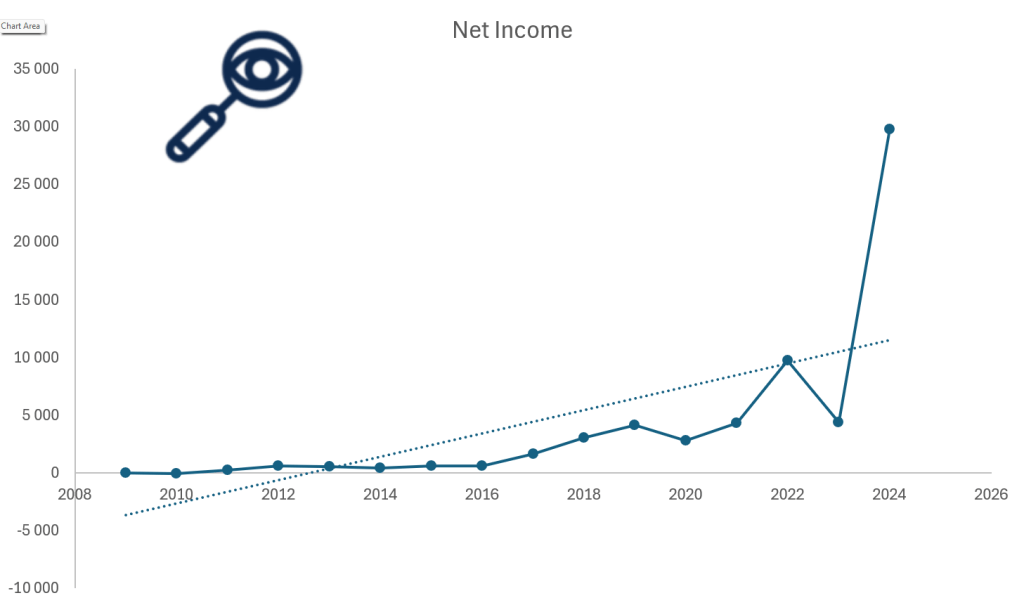
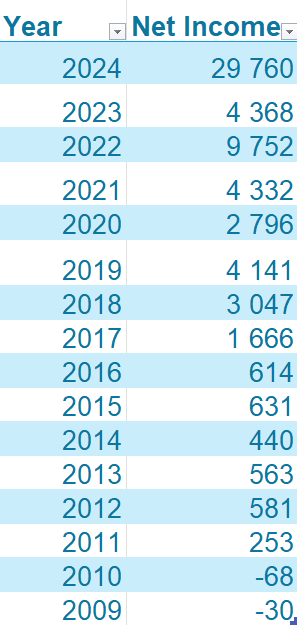
Illustration 6 and 7: Net Income of Canadian Solar from 2009 to 2023.
Net income is a crucial metric to evaluate when determining whether a company is a worthwhile investment. It represents a company’s net profit or loss after accounting for all revenues, income items, and expenses, calculated as Net Income = Revenue – Expenses.
As seen in Illustrations 6 and 7, Canadian Solar’s net profit has shown a slight upward trend but has mostly remained relatively flat with fluctuations since 2014, peaking around 250. This inconsistency is a red flag for potential investors, as it indicates that despite growing revenue, the company has struggled to achieve steady profit growth. Factors such as pricing pressure, industry competition, and fluctuating costs may be limiting profitability, making it difficult for investors to rely on sustained earnings growth. When investing in a company, increasing profits is one of the most—if not the most—important factors for investors. However, Canadian Solar has struggled to achieve consistent profitability, as its net income has remained relatively stable over the years despite growing revenue. This lack of sustained profit growth raises concerns about the company’s ability to improve margins and generate higher returns for shareholders in the long run.
Revenue breakdown
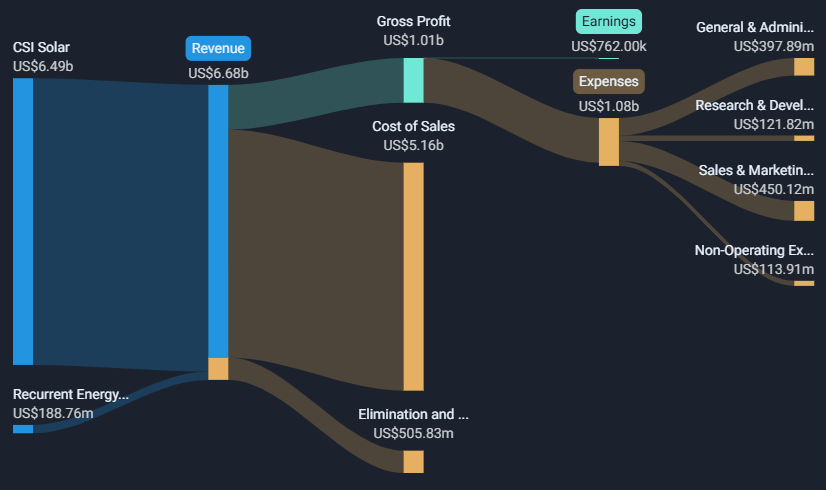
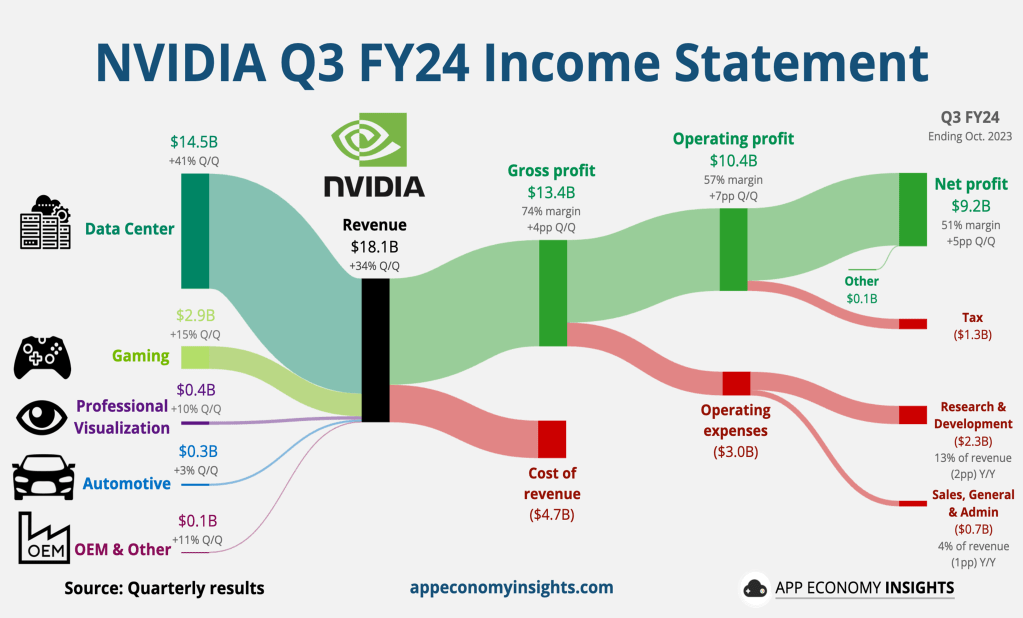
Illustration 8: Revenue Breakdown for Canadian Solar
As seen in Illustration 8, Canadian Solar is a pure-play solar energy company, generating all its revenue from the solar industry. This makes it an ideal investment opportunity for those seeking direct exposure to the solar sector. However, for investors looking for diversification within the broader utility sector, Canadian Solar may not be the best fit, as it lacks revenue streams from other energy sources or utility-related businesses.
Additionally, Illustration 8 highlights that the cost of sales in the solar energy industry is significantly high, which consumes a large portion of Canadian Solar’s revenue. On top of that, the company allocates substantial funds toward R&D, administration, and marketing, further limiting its net profit. As a result, despite strong revenue figures, the company’s actual profitability remains relatively low, which could be a concern for investors focused on earnings growth.
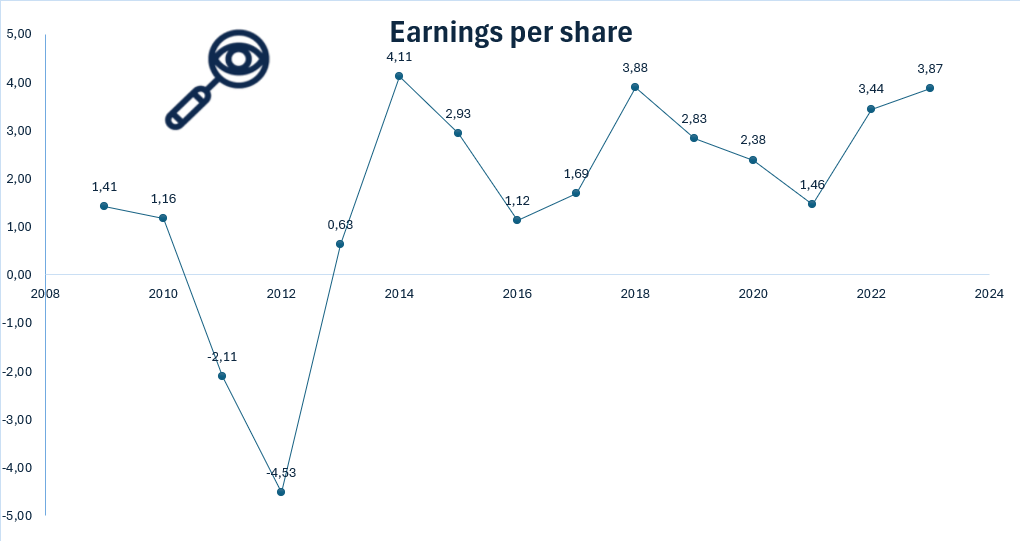
Earnings per shar (EPS)
Earnings Per Share (EPS) is a key financial metric that measures a company’s profitability on a per-share basis. It indicates how much profit a company generates for each outstanding share of its stock, and is used o assess a company’s financial health, profitability, and potential for growth. In other words this metric can tell us how profitable the business is,
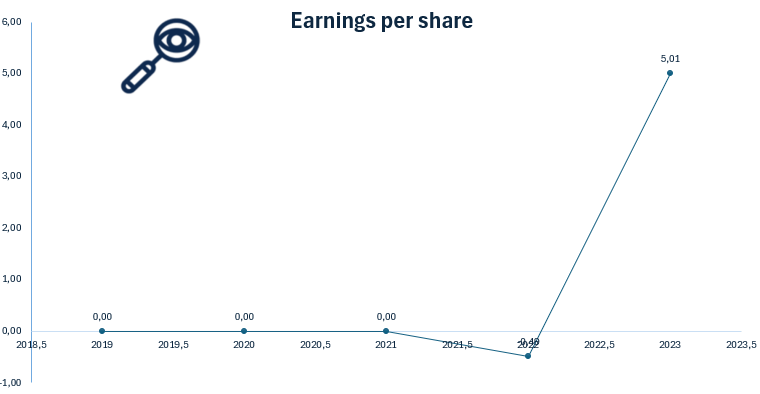
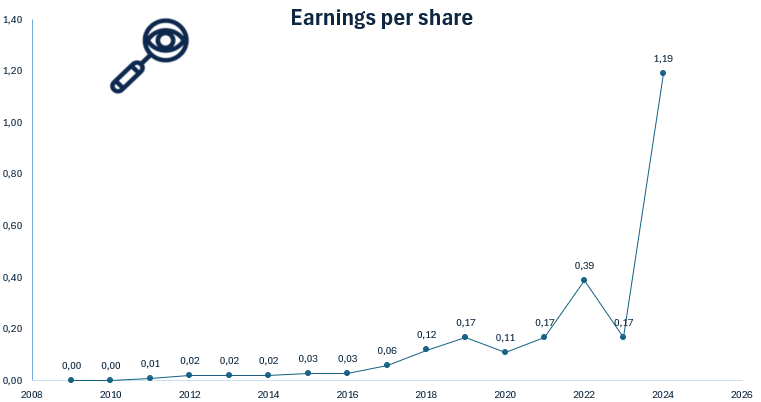
Illustration 9: Earnings per share for Canadian Solar from 2009 to 2023.
The EPS figure itself isn’t the primary focus for value investors—it can be 0.2 or 10, but what truly matters is the company’s ability to generate consistent earnings growth. A steadily increasing EPS over time signals strong financial health, profitability, and long-term value creation.
Canadian Solar’s earnings per share (EPS) performance from 2009 to 2023 presents a mixed picture for investors. While the company has demonstrated resilience and growth in revenue over the long term, its EPS has been highly volatile, with significant fluctuations rather than a consistent upward trend. Periods of strong earnings, such as in 2014, have been followed by years of weaker performance, making it difficult for investors to predict steady profit growth. This inconsistency can be a red flag for long-term investors who prioritize stable and growing earnings, as it suggests that Canadian Solar’s profitability is sensitive to external factors like pricing pressure, raw material costs, and government policies.
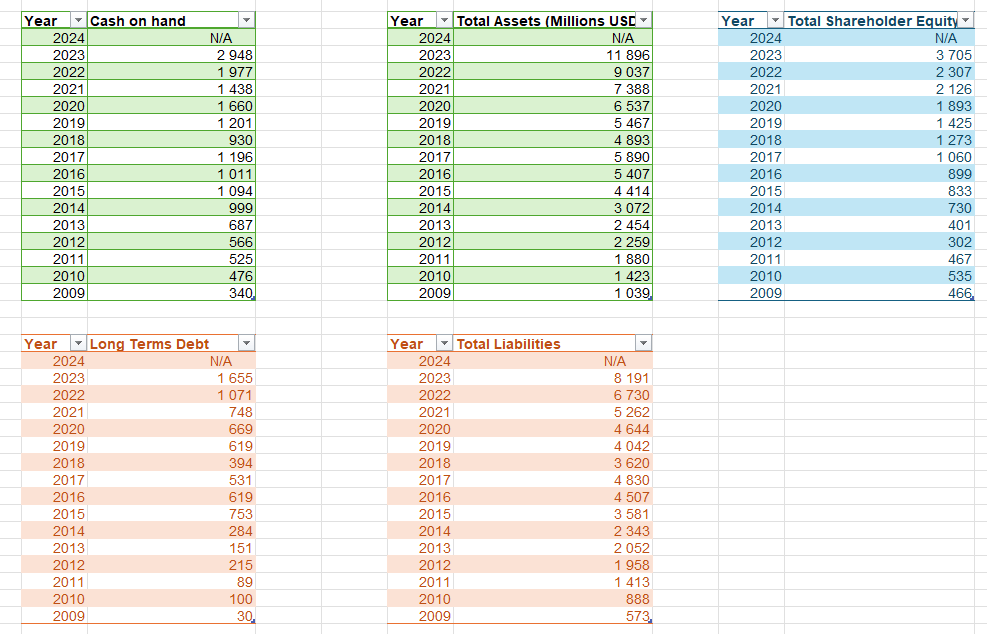
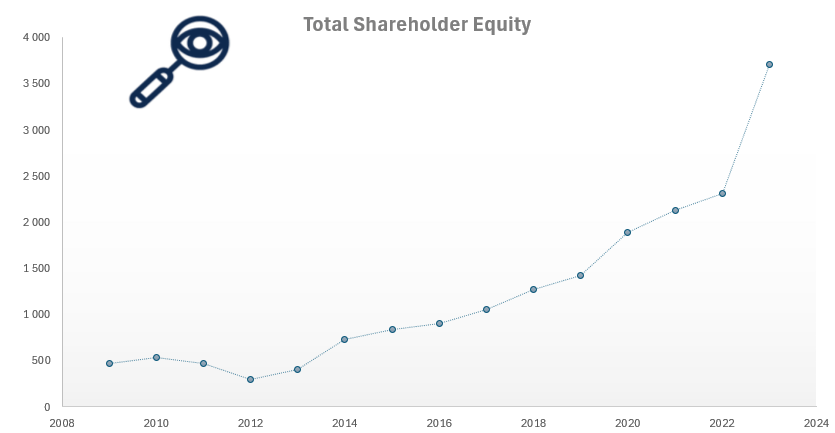
Assets and Liabilities
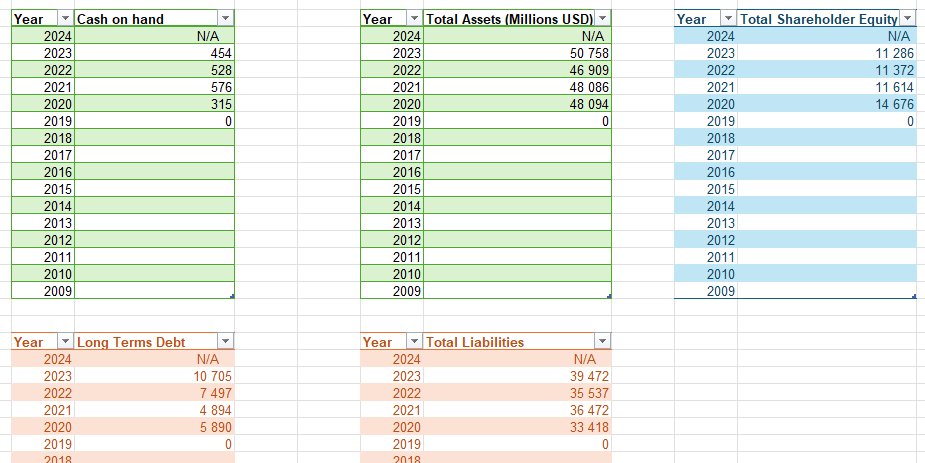
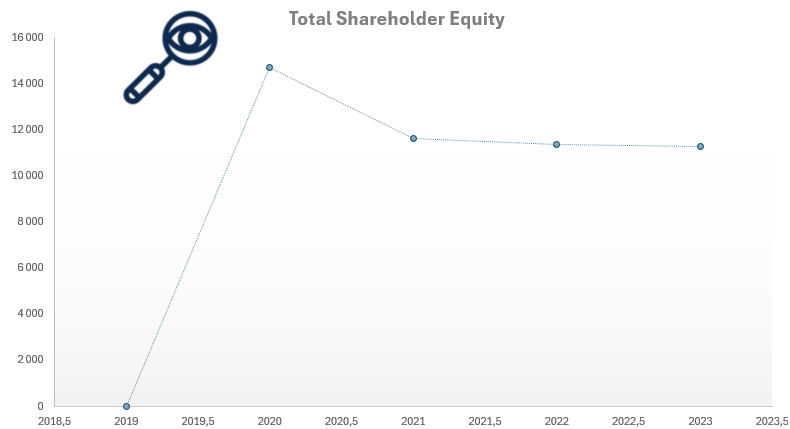
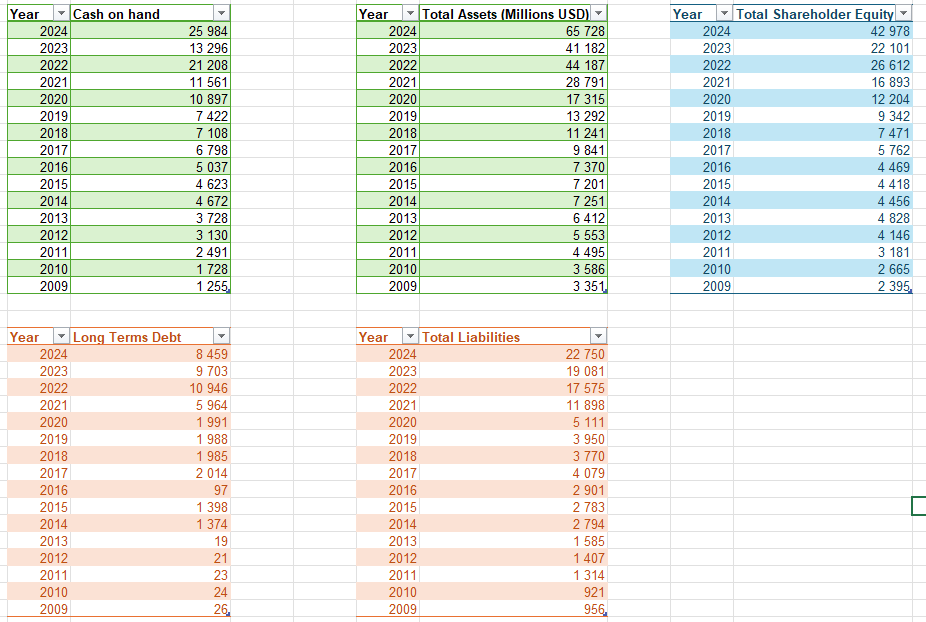
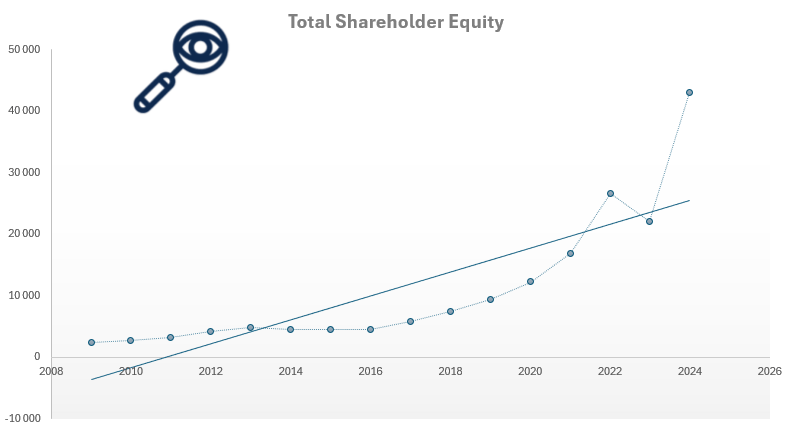
Illustration 10 and 11: Assets, Liabilities and Total Shareholder Equity for Canadian Solar from 2009 to 2023.
When evaluating a company as a potential investment, understanding its assets and liabilities is crucial. If a local business owner offered to sell their shop to you, one of the first questions—after determining its profitability—would be about its equity and assets. The same principle applies when assessing publicly traded companies like Dominion Energy.
As shown in Illustrations 10 and 11, Canadian Solar has a substantial asset base, totaling $11.9 billion in 2024. This steady asset growth over time is a positive sign, indicating that the company is expanding its operations, investing in new technologies, and strengthening its market position. A growing asset base often reflects a company’s ability to scale its business, acquire new projects, and improve its production capacity, which is particularly important in the highly competitive solar energy industry.
At the same time, Canadian Solar’s total liabilities have also increased significantly, rising from $573 million in 2009 to $8.2 billion in 2024. While such a sharp increase in debt might raise concerns for some investors, it is not necessarily a red flag given the nature of the solar energy business. Solar companies typically operate in a capital-intensive environment where they must secure substantial financing to fund large-scale projects, develop infrastructure, and maintain their competitive edge. Debt financing is often necessary for expanding solar farms, increasing manufacturing capacity, and advancing energy storage solutions, all of which contribute to long-term growth.
The key factor for investors is whether Canadian Solar can effectively manage its debt while maintaining strong revenue and profitability. If the company can generate consistent cash flow and sustain high demand for its products and services, its rising liabilities may not be a major issue. However, if debt levels continue to grow faster than revenue or profits, it could indicate financial strain, making it important for investors to monitor the company’s ability to service its obligations while maintaining profitability.
The cash on hand for Canadian Solar is a green flag for potential investors, as the company has $2.9 billion in readily available cash as of 2023. This strong cash reserve provides the company with flexibility and liquidity, enabling it to navigate market fluctuations, invest in new projects, and meet its short-term financial obligations without relying heavily on external financing.
Additionally, Canadian Solar’s long-term debt of $1.65 billion in 2023 is significantly lower than its available cash, which is a positive sign for investors. This indicates that the company has a solid financial cushion and is not overly reliant on debt to fund its operations. It suggests that Canadian Solar is in a strong position to manage its liabilities, fund future growth, and weather economic downturns without significant financial strain. This balance between cash and debt is reassuring for investors, as it reflects financial stability and prudent management of resources.
As seen in Illustration 11, Total Shareholder Equity—calculated as total assets minus total liabilities—has consistently grown over the past 14 years. This is a positive indicator for potential investors, as it suggests that Canadian Solar is building value over time rather than eroding its financial foundation. A steadily increasing shareholder equity indicates that the company’s assets are growing at a faster rate than its liabilities, which is a green flag for financial health. This trend suggests that Canadian Solar is successfully expanding its operations while maintaining a solid balance sheet. Additionally, rising equity provides a buffer against financial downturns, making the company more resilient in times of economic uncertainty. However, investors should also consider how this growth is achieved—whether through profitable operations or increased debt financing—to fully assess the sustainability of this trend.
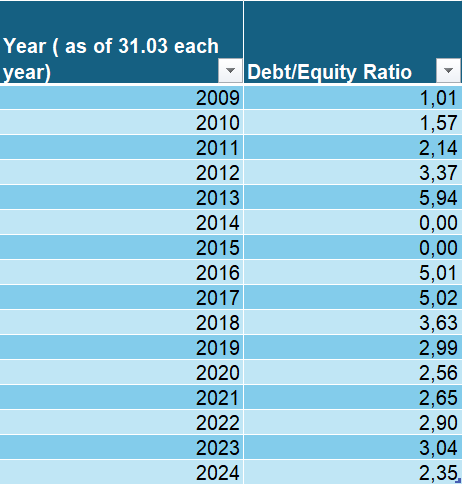
Debt to Equity Ratio
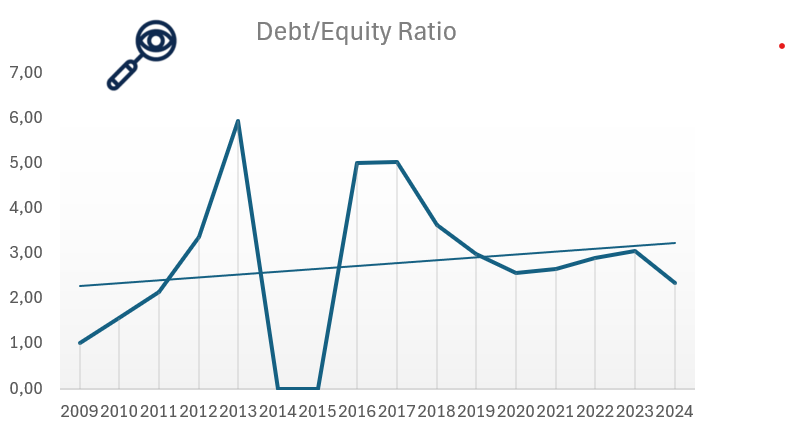
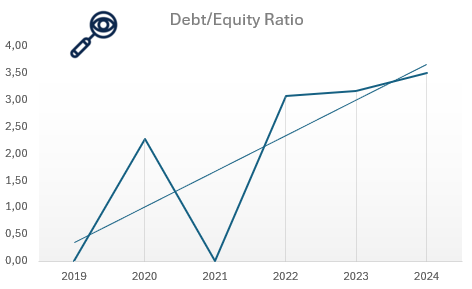
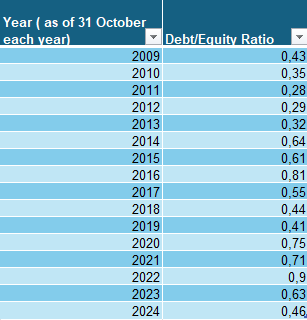
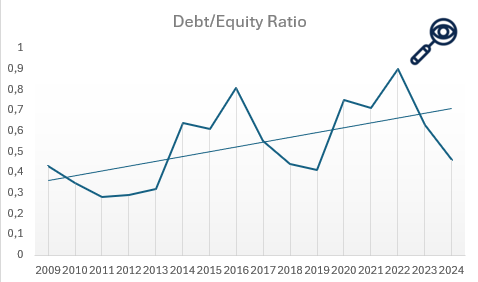
Illustration 12 and 13: The Debt to Equity ratio of Canadian Solar from 2009 to 2024.
The Debt-to-Equity (D/E) ratio is an important financial metric for assessing Canadian Solar’s financial leverage and risk. It compares the amount of debt the company uses to finance its operations relative to its shareholder equity. A high D/E ratio suggests that the company relies more heavily on debt to fuel growth, which could increase financial risk, especially during economic downturns when managing debt obligations becomes more challenging. In contrast, a lower D/E ratio indicates that Canadian Solar is primarily financed through equity, reducing financial risk but potentially limiting its ability to rapidly expand.
In recent years, Canadian Solar has maintained a relatively high D/E ratio, reflecting its reliance on both debt and equity financing to support its operations. This is typical for companies in the solar industry, as they often need to take on debt to fund large-scale projects, infrastructure, and expansion into new areas like energy storage. However, while leveraging debt is common in the sector, investors should remain cautious and monitor Canadian Solar’s ability to manage its increasing debt load. A high D/E ratio, particularly during periods of rising interest rates or market volatility, can place pressure on profitability and financial stability.
As of 2023, Canadian Solar’s D/E ratio reached nearly 6, and it was also high in 2016 and 2017, exceeding 5. While the company has made strides in reducing its debt and increasing equity over time, its D/E ratio remains substantially higher than the level recommended by investors like Warren Buffett, who prefers a ratio below 0.5. This suggests that while the company has made progress, Canadian Solar still carries a significant debt burden that investors should carefully assess to ensure it does not hinder long-term growth or financial health.
Price to earnings ratio (P/E)
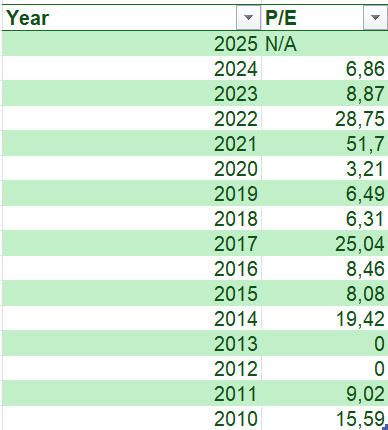
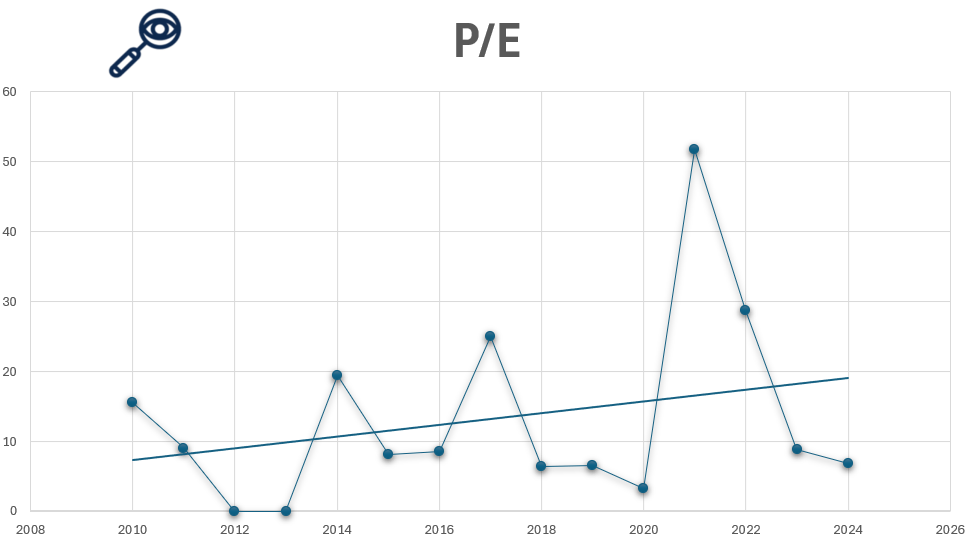
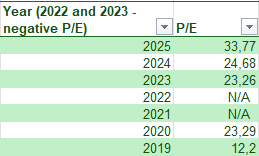
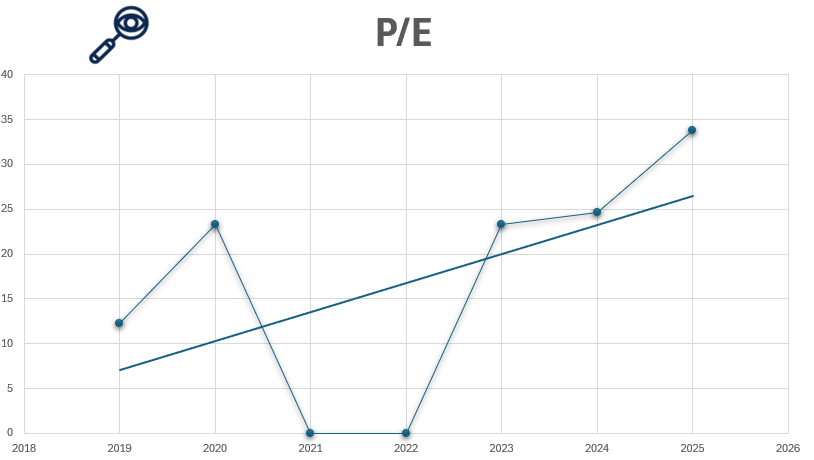
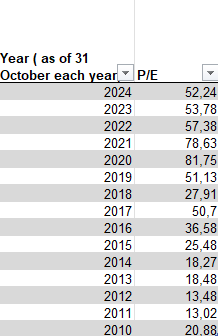
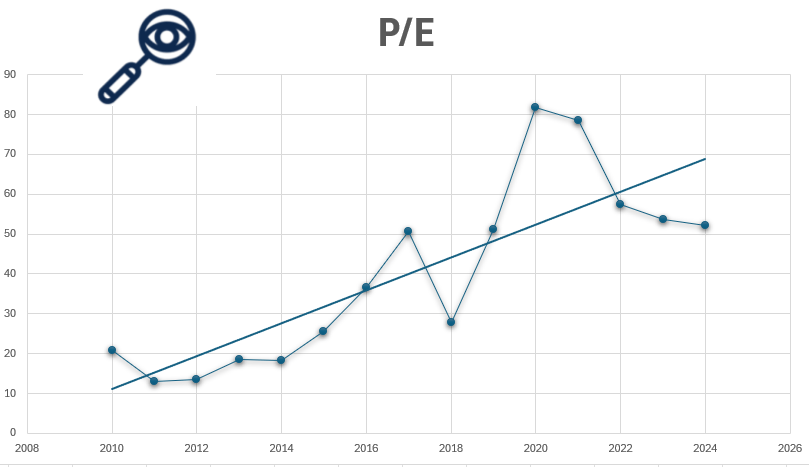
Illustration 14 and 15: The price to earning ratio for Canadian Solar from 2010 to 2024. The P/E ratio was negative and/or not available for 2012 and 2013.
For value investors, one of the most critical metrics when evaluating Canadian Solar’s stock is the price-to-earnings (P/E) ratio, as it helps assess whether the company is undervalued or overvalued. Even if a company has strong financials, purchasing its stock at a high price can lead to poor returns. For example, imagine a business generating solid profits of $1 million per year. If the owner offers to sell you the business for just $1, it would be an incredible deal. But if the owner asks for $1 trillion, even though the business is profitable, the price would be absurdly overvalued. The stock market works similarly—companies can be priced cheaply on some days and excessively expensive on others.
Warren Buffett, a legendary value investor, typically considers stocks with a P/E ratio of 15 or lower as “bargains.” A high P/E ratio suggests that investors are paying a premium for the company’s earnings, expecting significant growth. However, this also indicates that the stock is expensive relative to its earnings, which can be a red flag for value investors. Canadian Solar’s P/E ratio has fluctuated widely over the years. For example, it was in bargain territory at 4.93 in 2011, before reaching a strongly overpriced level of 62.2 in 2021. However, with the current P/E ratio of 29.90 at 16 February 2025, Canadian Solar’s stock can be seen as fairly priced, meaning it is neither undervalued nor an ideal investment for value investors seeking a strong bargain.
The strongly fluctuating prices for Canadian Solar indicates that the company’s stock price is volatile relative to its earnings, and signal uncertainty in the market or changing investor expectations about future growth. For potential investors the fluctuating prices gives them the opportunity to buy the stock at bargain price, but they should be very careful not buy at the top.
Dividend
Canadian Solar does not currently offer a dividend, focusing instead on reinvesting its profits into growth initiatives, including expanding solar projects and developing energy storage solutions. This approach is common for growth-focused companies, especially in the renewable energy sector, where significant capital is needed for expansion.
While Canadian Solar doesn’t provide regular income through dividends, its strategy of reinvestment can be appealing to growth investors looking for long-term capital appreciation rather than immediate returns. However, the lack of dividends may be a red flag for income-focused investors who rely on steady income from their investments. This strategy could also limit some investor interest, especially those seeking consistent payouts.
To summarize:
✅ Green Flag:
Growth Potential: By reinvesting profits, Canadian Solar is positioning itself for long-term growth in the rapidly expanding solar and renewable energy sectors.
Capital Allocation: The company prioritizes strategic investments in projects and innovation over dividend payouts.
🚩 Red Flag:
No Dividend: The lack of dividends may deter income-seeking investors, as Canadian Solar reinvests all profits rather than distributing earnings to shareholders.
Insider Trading
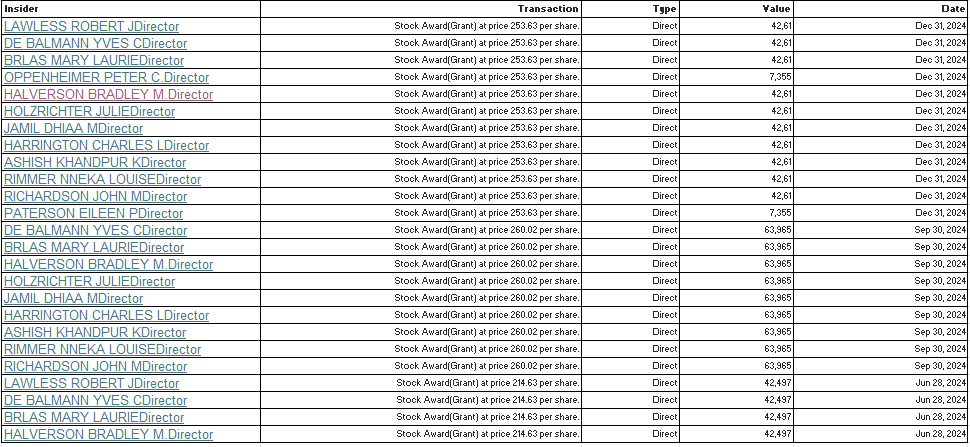
A key metric to consider when evaluating Canadian Solar as an investment isinsider trading activity, specifically whether company insiders have been buying or selling shares in the past year. It’s important to focus on who is making these transactions, with particular attention to directors, as their actions often provide more insight into the company’s future prospects than those of officers.
As shown in recent data, there has been no insider selling at Canadian Solar. This is a green flag for investors, as it suggests that insiders have confidence in the company’s future performance and are holding on to their shares, rather than liquidating them.
Other Company info
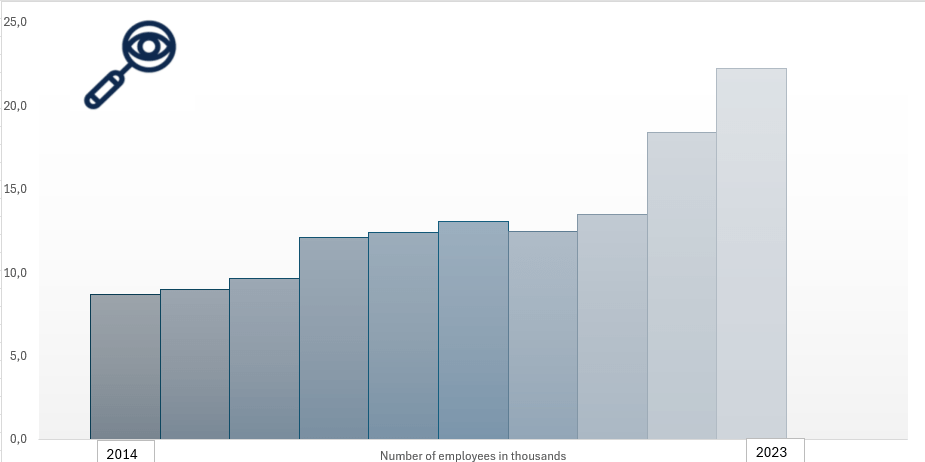
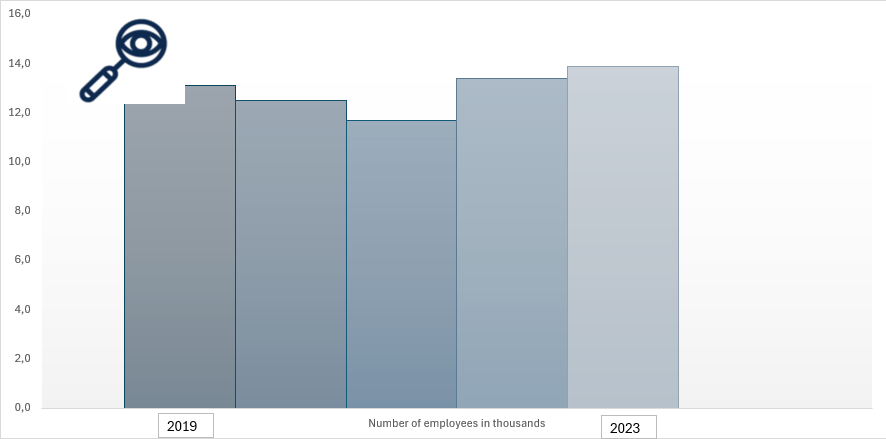
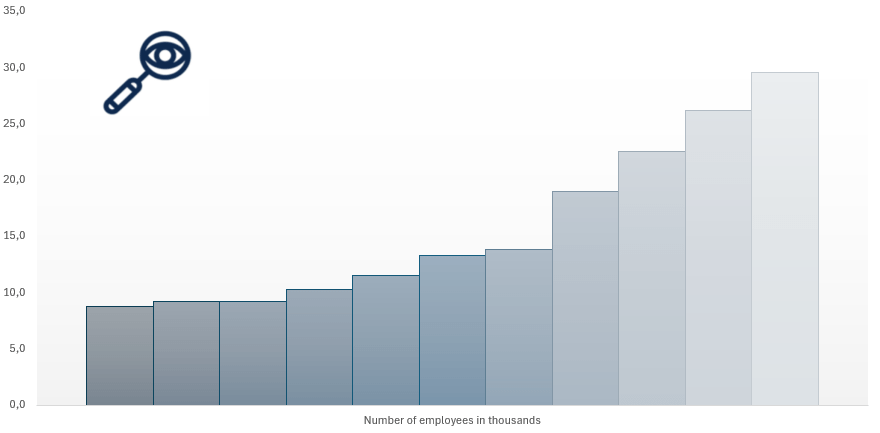
As of the latest data, Canadian Solar employs approximately 22,200 people, reflecting steady growth from around 8,700 employees in 2014. The company was founded in 2001 and is headquartered in Ontario, Canada. It is listed on the NASDAQ exchange under the ticker CSIQ and operates within the Solar Energy industry under the broader Renewable Energy sector. Canadian Solar currently has approximately 73.3 million shares outstanding and a market capitalization of around USD 4.58 billion.
The company’s corporate headquarters is located at 545 Speedvale Avenue West, Guelph, Ontario N1K 1E6, Canada. For more information, you can visit their official website at www.canadiansolar.com.
Illustration 16-18: Number of employees at Canadian Solar and its location in Ontario, Canada.
Canadian Solar presents a promising long-term opportunity, particularly for investors interested in the renewable energy sector. The company is making significant strides in solar energy, energy storage, and utility-scale projects, positioning itself well for the growing demand for sustainable energy solutions. However, its financial health warrants careful consideration.
Although Canadian Solar has a solid asset base, its rising debt levels and increasing liabilities each year contribute to heightened financial risk. A significant portion of its revenue is consumed by costs of goods sold and operating expenses, limiting its profitability. As a result, while Canadian Solar has shown growth, its profitability has been inconsistent, and some of its expansion plans have not met expectations.
From a value investing standpoint, Canadian Solar does not appear to be undervalued, which may make it less appealing for investors seeking stocks with strong financials available at a discount. While the company holds substantial growth potential in the renewable energy sector, it’s crucial for investors to consider the associated risks, especially given its financial structure and profitability challenges. A key concern is that despite the increase in revenue, Canadian Solar’s net profit has remained stagnant, signaling potential inefficiencies or other underlying issues that may affect future profitability. Given these factors, our recommendation is to proceed with caution. If you find our analysis valuable, consider subscribing by entering your email below.
The decision between starting your own business or investing in stocks is one of the most critical financial choices an individual can make. Both paths offer unique opportunities for wealth creation, but they also come with distinct risks and challenges. This article aims to explore all the possible factors to consider when choosing between entrepreneurship and stock market investing, including risk tolerance, capital availability, time commitment, skillset, personal goals, and economic conditions.
Understanding the Fundamentals
Before diving into the key factors, let’s define each option clearly:
Starting a Business involves creating and managing your own company, that offers goods or services. It requires a business idea, operational planning, marketing, and a long-term commitment to growth and management.
Investing in Self-Picked Stocks means selecting and purchasing shares of companies based on research and analysis, aiming for capital appreciation, dividends, or both. This can be everything from small penny stocks to the stocks of some of the biggest and most well established companies in the world.
Investing in stocks and starting a business both involve risk, research, and the potential for long-term wealth, but they differ in control and involvement. Investors rely on companies to grow their money, often passively, while entrepreneurs actively build and manage their businesses.
Both require patience, strategy, and the ability to handle uncertainty, but a business offers more control over success, whereas stocks provide diversification and liquidity. Ultimately, one is about owning a piece of someone else’s success, while the other is about creating your own. Each approach can lead to financial success but in very different ways. The choice depends on individual circumstances, risk appetite, and long-term objectives
1. Risk Tolerance
Starting a Business: Involves high risk, with a significant percentage of startups failing within the first few years. Risks include financial loss, market competition, operational challenges, and economic downturns.
Illustration 1: If entrepreneurship or the stock market is the best alternative depends on how much risk you are willing to take on.
The failure rate if newly started and established companies is quite high. After the first year, about 20% of new businesses fail. After 3 years: Around 45% of businesses fail (~55% survive). After 5 years: Roughly 50%–60% of businesses fail (~40%–50% survive). And after 10 years: Around 70%–90% of businesses fail.
It’s important to note that these figures only reflect business survival rates, not actual success. Among the companies that avoid bankruptcy, 80–90% remain small, with modest profits or just breaking even. Around 5–10% achieve moderate success, growing into stable mid-sized businesses, while 1–5% experience significant growth, becoming highly profitable and expanding nationally or internationally. Fewer than 0.1% reach unicorn status, with a valuation of $1 billion or more. Moderate is here defined as a company that has a net profit of USD 500 000 to USD 20 000 000.
Investing in Stocks: Stock market investments also carry risks, such as market volatility, economic downturns, and company-specific risks. However, diversified investing can help mitigate these risks.
The average person in stock investing tends to underperform the market, with individual investors typically achieving returns around 3%–5% annually, while the S&P 500 historically averages 7%–10% per year, adjusted for inflation. Many investors struggle with poor timing, often buying high and selling low, or making emotional decisions during market volatility. Active traders, trying to pick stocks or time the market, often face higher fees and taxes, which further erode returns. In contrast, those who invest passively in diversified index funds generally align more closely with the market’s long-term average returns, making it a more reliable strategy for most investors.
However, the average stock investor do get a much better return on money, on average, compared to an entrepreneur.
Illustration 2: If you are good with Uncertainty, entrepreneurship can be for you.
Key Consideration: If you have a high-risk tolerance and are comfortable with uncertainty, entrepreneurship could be a good fit. However, if you prefer more calculated risks with the option for diversification, investing in stocks might be the better route. Both options involve risk, but the right choice depends on your personal risk tolerance. Remember, the higher the risk, the greater the potential return—whether you’re choosing stocks or deciding whether to start a business.
2. Capital Requirements
Starting a Business: Starting a business requires significant upfront investment for product development, inventory, marketing, and operational costs. These initial expenses can be substantial, as you’ll need to cover everything from creating your product or service to securing a physical location or paying for website hosting. Rent, employee salaries, and advertising campaigns can also add up quickly. Many entrepreneurs underestimate the financial strain at the beginning, and without enough funding, businesses can easily fail.
You’ll need to save up enough money to cover all these costs before you even start generating income. Inventory purchases, production costs, and operational overheads are not cheap, and it’s easy to feel overwhelmed by the scale of these expenses. If you don’t have the right resources or backup funding, it can be difficult to maintain momentum during the early stages, especially if cash flow is slow. Unlike investing in stocks, which can be done with a relatively small initial capital, starting a business demands a much higher upfront commitment.
Illustration 3: Starting a Business often requires saved capital.
Investing in Stocks: Requires less capital initially. With as little as a few hundred dollars, you can start investing in stocks. While the capital required to start investing in stocks is relatively low, it’s important to remember that achieving significant returns often requires a long-term commitment and a consistent investment strategy. While you can start small, many investors opt to increase their capital gradually, taking advantage of compounding returns. However, it’s essential to be mindful of the costs involved, such as trading fees, commissions, or taxes on dividends and capital gains, which can eat into your profits.
Key Consideration: If you have substantial capital and access to funding, starting a business may be feasible. If capital is limited, stock investing offers a lower barrier to entry.
3. Time Commitment
Starting a Business: Starting a business requires full-time dedication, particularly in the early stages when the foundation is being built. Running a business demands long hours, as entrepreneurs must juggle various tasks, from product development and marketing to managing finances and customer service. It’s a constant cycle of problem-solving and adapting to unforeseen challenges, whether it’s adjusting to market changes, troubleshooting operational issues, or making tough decisions. The ability to remain flexible and resilient is crucial, as the business landscape can shift quickly and often requires entrepreneurs to pivot or refine their approach to stay competitive.
On average, entrepreneurs tend to work 8 to 12 hours a day. In the early stages of a business, this can often stretch beyond 12 hours a day, especially when the entrepreneur is handling multiple roles like marketing, customer service, and operations. As the business matures and more employees are hired, the hours may become more manageable, but many entrepreneurs still put in long days, sometimes working evenings or weekends to stay on top of tasks and ensure the business continues to grow.
Illustration 4: Starting a Business can take significant time.
Investing in Stocks: While active trading requires significant research, long-term investing can be more passive. Stock investing generally requires fewer hours per day compared to running a business. For most investors, he daily time commitment can be quite minimal. On average, investors may spend 30 minutes to an hour a day checking their portfolios, staying updated on market trends, or reviewing the performance of specific stocks.
For those actively trading or managing their investments, it could require more time, possibly 2 to 4 hours a day, particularly if they are making frequent trades or conducting in-depth research. However, stock investing doesn’t typically demand the constant attention that a business requires, and the time commitment can be adjusted based on the investor’s approach—whether it’s passive, active, or a mix of both. If you are picking your own stock, conducting fundamental analysis of all the different companies could take significant time.
Key Consideration: If you prefer flexibility and passive income, stock investing may be a better choice. If you are passionate about building something and willing to dedicate years to it, entrepreneurship might be the way to go.
4. Skillset and Expertise
Starting a Business: Starting a business requires a broad set of skills, including knowledge of business operations, finance, marketing, management, and industry-specific expertise. Entrepreneurs need to understand how to efficiently manage resources, create a profitable business model, and navigate regulatory requirements. Financial knowledge is crucial for managing cash flow, budgeting, and ensuring the business remains solvent. Additionally, marketing and management skills are essential for attracting customers and leading a team, while industry-specific knowledge helps ensure the business can compete effectively in its sector.
Investing in Stocks: Investing in stocks requires a solid understanding of financial markets, stock valuation, economic trends, and risk management. Investors need to assess a company’s financial health, understand how market forces can affect stock prices, and evaluate the potential for future growth. They must also manage risk, which involves diversifying investments and understanding how broader economic conditions can impact their portfolio. Staying informed about global and local market trends, as well as financial reports, is key to making informed investment decisions.
Illustration 5: Expertise is an important factor to take into account.
Key Consideration: f you have strong business acumen and leadership skills, running a business might be a better fit for you. Entrepreneurship allows you to directly apply your skills in management, problem-solving, and decision-making. On the other hand, if you enjoy analyzing companies, financial data, and understanding market trends, stock investing could be a better option. Both paths require a keen understanding of numbers, but the level of involvement and the type of expertise needed differ significantly.
5. Potential Returns and Scalability
Starting a Business: Starting a business can offer unlimited earnings if successful, but profits depend heavily on execution, market demand, and the scalability of the business model.
Investing in Stocks: Stocks can also provide unlimited earnings, depending on the type of stocks and the performance of the companies you invest in. While stock market returns are generally more predictable, with historical averages around 7-10% annually, certain high-growth stocks or successful investments can lead to substantial, even life-changing returns. However, like any investment, there is risk involved, and not all stocks will provide the same level of growth.
Illustration 6: Scalability is an important factor to take into account.
Key Consideration: If you are willing to take on the risk for potentially higher earnings, starting a business could be ideal. However, if you prefer steady growth with more predictable returns, investing in stocks may be the better choice, with the opportunity for unlimited earnings depending on your investment choices.
6. Control and Decision-Making
Starting a Business: Starting a business offers full control over decision-making, allowing entrepreneurs to shape the direction of the company, set goals, and implement strategies. However, this autonomy comes with the responsibility for both the successes and failures of the business. Entrepreneurs must navigate challenges, adapt to changes, and make critical decisions across all aspects of the business, from operations to finances and marketing.
It also means that entrepreneurs will have to face a lot more stress and work, as mentioned, longer hours. They also need to have a much broader skillset, taking decision in everything from marketing issues to supply chain issues.
Investing in Stocks: When investing in stocks, you have control over which stocks to buy and sell, but you don’t have direct influence over the day-to-day operations or strategic decisions of the companies in which you invest. Your role is limited to making investment decisions based on research and analysis, leaving the management and execution to the company’s leadership team. While you can vote on certain company matters (in the case of voting shares), your impact on decisions is minimal compared to owning and running a business.
Key Consideration: If you value autonomy and want to have complete control over your decisions and the direction of a business, entrepreneurship offers that control. On the other hand, if you prefer to invest in established companies and trust in their management teams to execute plans, stock investing is a good option, allowing you to benefit from their expertise without the responsibility of day-to-day management.
7. Market and Economic Conditions
Starting a Business: Market trends, customer demand, and overall economic conditions play a significant role in determining the viability and success of a business. If the market is favorable, with strong consumer demand and economic stability, it can provide a solid foundation for a new venture. However, economic downturns, shifts in consumer preferences, or high competition can make it difficult for a business to succeed, even if the entrepreneur has a strong plan in place.
Investing in Stocks: Similarly, market cycles have a major impact on stock prices, and economic downturns can reduce the value of investments, lower returns, or lead to losses. Stock prices are often affected by broader economic conditions such as inflation, interest rates, and corporate earnings. While investors can benefit from economic booms and growing markets, economic recessions or market volatility can negatively influence the performance of stocks.
Key Consideration: If the economy is booming and there is strong demand for your business idea, it could be an ideal time to start a business. On the other hand, if markets are stable and showing steady growth, investing in stocks may offer a safer, more predictable opportunity with the potential for growth. The decision depends largely on your perception of the market’s current and future conditions. However, both starting a business and investing in stocks will be affected by the economy and market conditions, and it is near impossible timing the market.
8. Tax Cons
Starting a Business: Business owners can benefit from a variety of tax deductions that can help reduce their taxable income. These include deductions for business expenses like operational costs, office supplies, salaries, marketing, and even depreciation of assets. By deducting these expenses, business owners can lower their overall tax burden, making it more cost-effective to run and grow a business. However, the specific deductions available may vary depending on the country and local tax laws.
Investing in Stocks: When it comes to investing in stocks, capital gains tax applies to profits made from selling investments. However, there are tax-efficient strategies that can help reduce liabilities, such as holding investments for the long term to qualify for lower long-term capital gains tax rates or using tax-advantaged retirement accounts like IRAs or 401(k)s. These strategies can minimize the amount of taxes owed on investment profits, allowing investors to keep more of their earnings.
Illustration 7: One of the most important factors that is very often forgotten. There can be a lot of money to be saved in deductions.
Key Consideration: Depending on the tax laws in your country, one option may be more tax-efficient than the other. For instance, owning a business may offer more immediate tax benefits through deductions, while investing in stocks might provide more favorable tax treatment on long-term gains or through retirement accounts. The right choice will depend on your specific financial situation and the tax regulations in your area.
9. Emotional and Psychological Factors
Starting a Business: Starting a business involves significant emotional and psychological challenges. Entrepreneurs often face high levels of stress due to the uncertainty of the venture’s success, tight deadlines, and the need to make tough decisions on a daily basis. There are frequent emotional ups and downs, from the excitement of achieving milestones to the pressure of overcoming setbacks. Running a business requires a strong sense of persistence, resilience, and the ability to manage stress while navigating unpredictable challenges.
Illustration 8: The emotional and psychological effect is also a factor to take into account.
Investing in Stocks: Investing in stocks can also be stressful, particularly during market downturns or when investments don’t perform as expected. However, it is generally less emotionally taxing than running a business because investors have less daily involvement in managing the companies they invest in. While market volatility can lead to anxiety, stock investors typically have a more analytical, long-term focus and may be able to detach emotionally from short-term fluctuations.
Key Consideration: If you thrive under pressure and can manage uncertainty effectively, entrepreneurship might be the right path for you. It requires a hands-on approach and the ability to stay focused despite challenges. On the other hand, if you prefer a more analytical and systematic approach to decision-making, stock investing may be a better fit, offering the opportunity to reduce emotional strain while still achieving financial growth.
10. Exit Strategy
Starting a Business: Exiting a business can be a complex and time-consuming process. The most common exit strategies include selling the business, merging with another company, or liquidating the assets. Each option requires careful planning and consideration, as it often involves negotiations, legal procedures, and tax implications. The process can take months or even years, depending on the business size and market conditions, and may not always result in a favorable return.
Investing in Stocks: Stocks, on the other hand, are liquid assets that can be sold at any time, providing more flexibility and ease of access to your money. Unlike a business, which requires a detailed exit strategy, stocks can be quickly converted into cash based on market conditions. This liquidity makes investing in stocks a more accessible option for those who may need to access their funds more readily or prefer to have more control over when and how they liquidate their investments.
Key Consideration: If you value flexibility and easier access to your money, investing in stocks is likely the better option. The liquidity of stocks allows for quicker exits and fewer complications, whereas exiting a business often involves a more involved and uncertain process.
Conclusion: Which One Is Right for You?
Choosing between starting a business and investing in stocks depends on your personal preferences, financial situation, and risk tolerance.
Go for starting a business if:
You have a high-risk tolerance.
You have capital and funding options.
You are passionate about building something from scratch.
Constellation Energy Corporation stands as a prominent American energy company specializing in electric power, natural gas, and energy management services. Serving approximately two million customers across the continental United States, Constellation has solidified its position as a key player in the nation’s energy sector.
Company History
The origins of Constellation Energy trace back to 1999 when Baltimore Gas and Electric Company (BGE) established it as a holding company. Over the years, Constellation expanded its operations, becoming a Fortune 500 company and one of the largest electricity producers in the United States. In 2012, a significant merger with Exelon Corporation occurred, leading to the rebranding of its energy supply business as Constellation, an Exelon company. This merger integrated Constellation’s extensive energy production capabilities with Exelon’s resources, enhancing its market presence.
A decade later, in 2022, Constellation Energy was spun off from Exelon, reestablishing itself as an independent entity. Former subsidiary Baltimore Gas & Electric remained part of Exelon. Since becoming independent, Constellation has grown and made headlines by, in September 2024, entering into a contract with Microsoft to restart the undamaged nuclear reactor at the Three Mile Island plant. The company is also planning to upgrade other existing reactor plants to provide more power.
In January 2025, Constellation agreed to acquire the natural gas and geothermal power provider Calpine for $16.4 billion ($26.6bn including debt) in a cash-and-stock deal. Approval of the purchase by state and federal regulators will be necessary.
Operations and Business Overview
Constellation Energy operates a diverse portfolio of energy assets, encompassing nuclear, natural gas, wind, solar, and hydroelectric power. With a total capacity of approximately 32,400 megawatts, the company generates enough energy to power 16 million homes and businesses. Notably, Constellation is the nation’s largest producer of carbon-free energy, contributing to 10% of all clean power on the U.S. grid. This diverse energy mix not only ensures reliability but also underscores the company’s commitment to sustainability.
Illustration 1: Constellation Energy logo symbolizing energy flow and commitment to sustainability.
Constellation Energy’s operation currently includes natural gas, nuclear energy, wind energy, hydro energy and solar energy. The company will probably also het into geothermal power after the aquisition of Calpine.
Customer Base and Energy Supply
Constellation Energy serves a wide range of customers, from residential users to large industrial corporations and government entities. Many Fortune 500 companies, including Amazon, Microsoft, and McDonald’s, have signed long-term power agreements with Constellation to secure 100% renewable energy for their operations.
Illustration 2: Constellation Energy Generating Cpacity breakdown
The largest energy source for Constellation in Nuclear energy. Constellation Energy is the largest producer of carbon-free electricity in the U.S., with 23 nuclear reactors across 14 sites producing about 21,000 megawatts (MW) of clean energy. Constellation’s nuclear fleet is primarily located in Illinois, Maryland, New York, and Pennsylvania. The company has heavily invested in extending the life of existing nuclear plants and is exploring small modular reactors (SMRs) as part of its future strategy. The company has heavily invested in extending the life of existing nuclear plants and is exploring small modular reactors (SMRs) as part of its future strategy.
While Constellation focuses on clean energy, natural gas-fired power plants remain an important part of its operations. The company has 6,000+ MW of natural gas capacity, making it one of the largest gas-fired power producers in the country, and it is its second largest energy source at the moment.
As part of its clean energy initiative, Constellation operates multiple large-scale wind and solar farms across the U.S. Constellation Energy also operates hydroelectric power plants, although this segment represents a smaller portion of its total energy mix.
Competitors and Competitive Advantage
In the competitive energy market, Constellation Energy faces competition from major providers such as Duke Energy, NextEra Energy, and Southern Company. Constellation’s competitive advantage lies in its diverse energy mix, substantial carbon-free energy production, and strategic partnerships. The company’s focus on renewable energy and innovative solutions positions it well to meet the evolving demands of the energy market.
Illustration 3: Constellation Energy is a big player in the Nuclear Energy Market
One of Constellation’s major competitive advantages is its nuclear energy infrastructure, which ensures stable, 24/7 clean energy compared to intermittent renewables like wind and solar. The company has also secured long-term energy contracts with major corporations like Amazon, Microsoft, and McDonald’s, providing a steady revenue stream. Additionally, Constellation is investing in carbon capture technology, hydrogen development, and smart grid innovations to stay ahead in the clean energy transition.
Community Engagement
Beyond its business operations, Constellation is deeply involved in community initiatives. The company ranks second in local corporate giving among Baltimore-based companies, donating $7.10 million in 2017. Additionally, Constellation provides grants to local schools that implement education programs promoting science and technology, reflecting its commitment to fostering education and community development.
Stock Analysis
Revenue and Profit
To assess a company’s true value and investment potential, analyzing its revenue and profits is a fundamental first step. It’s important to remember that a stock represents ownership in a real business, much like the small companies in your local community. If a small business owner approached you with an offer to buy their company, your first questions would likely be: “What’s the price?” and “How much does the company generate in revenue and profit each year?”
Beyond just current earnings, it’s crucial to examine the company’s financial performance over time. This helps determine whether recent profits are part of a consistent upward trend, or if they are temporary spikes or part of a larger decline. A long-term perspective ensures that an investment is based on sustainable growth rather than short-term fluctuations.
Illustration 4 and 5: Revenue of Constellation Energy from 2019 to 2023. Due to Constellation becoming an independent company from Exelon first in 2022, numbers for Constellation Energy is not available before 2019.
As illustrated in Figures 4 and 5, Constellation Energy’s revenue has shown a steady upward trend over the past five years. While this may not provide a long-term dataset for deep historical analysis, the consistent growth in revenue is a positive indicator that should not be overlooked by investors. A steadily increasing revenue stream suggests strong demand, effective business operations, and potential for future profitability. Moreover, this trend signals that the company is successfully expanding its market presence and capitalizing on industry growth opportunities, making it a promising prospect for long-term investors.
Revenue breakdown
Illustration 6: Revenue breakdown of Constellation Energy gathered from gurufocus.
As shown in Illustration 6, Constellation Energy’s revenue comes from a diverse range of sources, which is a positive sign for investors. A diversified revenue stream indicates that the company is not overly reliant on any single source of income, reducing risk and providing stability. However, it’s important to note that the company’s COGS (Cost of Goods Sold) eats up a significant portion of its revenue. This is a negative aspect, as high operating costs, particularly related to fuel and maintenance, eat into profitability. While it is common in the energy sector, the substantial impact of these costs means that a large chunk of revenue is absorbed by expenses, limiting the company’s ability to generate higher profits.
Net Income
Illustration 7 and 8: Net Income of Constellation Energy for the past five years. Due to Constellation becoming an independent company from Exelon first in 2022, numbers for Constellation Energy is not available before 2019.
Net income is a crucial metric to evaluate when determining whether a company is a worthwhile investment. It represents a company’s net profit or loss after accounting for all revenues, income items, and expenses, calculated as Net Income = Revenue – Expenses.
The Net Income of Constellation Energy raises a red flag, as it has not only remained at a low level but has also been negative at times, meaning the company’s expenses have exceeded its revenue. This suggests that Constellation has been operating at a loss in certain periods, which is concerning for potential investors. Negative net income indicates that the company is struggling to control costs or increase profitability, which could raise doubts about its financial health and ability to generate sustainable returns. It is crucial for investors to carefully monitor this trend, as ongoing losses could signal deeper operational or strategic issues that need to be addressed.
Earnings per Share (EPS)
Illustration 9: Earnings per share for Constellation Energy from 2019 to 2013. Due to Constellation becoming an independent company from Exelon first in 2022, numbers for Constellation Energy is not available before 2019.
Earnings Per Share (EPS) is a key financial metric that measures a company’s profitability on a per-share basis. It indicates how much profit a company generates for each outstanding share of its stock, and is used o assess a company’s financial health, profitability, and potential for growth. In other words this metric can tell us how profitable the business is. The EPS figure itself isn’t the primary focus for value investors—it can be 0.2 or 10, but what truly matters is the price-to-earnings (P/E) ratio and the company’s ability to generate consistent earnings growth. A steadily increasing EPS over time signals strong financial health, profitability, and long-term value creation.
For Constellation Energy, its EPS performance raises concerns, making it more of a red flag than a green one. Over the past few years, Constellation’s EPS has been inconsistent, with periods of negative earnings, indicating that the company has struggled with profitability. A fluctuating or negative EPS is a warning sign for investors, as it suggests unstable earnings and financial uncertainty. Ideally, long-term investors look for companies with a steadily growing EPS, as this signals strong financial health and increasing shareholder value—something Constellation has yet to demonstrate consistently.
Additionally, because Constellation operates in the capital-intensive energy sector, high costs related to fuel, maintenance, and infrastructure investments eat into its profits, making it difficult to maintain a strong EPS. Unless the company significantly improves its profitability, reduces its cost structure, or benefits from external factors like rising electricity prices, its EPS will remain a concern for investors looking for stability and long-term growth. While Constellation Energy has potential in the clean energy sector, its EPS performance suggests higher risk, making it less attractive for conservative, value-focused investors.
Assets and Liabilities
Illustration 10 and 11: Assets and Liabilities of Constellation Energy from 2019 to 2023. ue to Constellation becoming an independent company from Exelon first in 2022, numbers for Constellation Energy is not available before 2019.
When evaluating a company as a potential investment, understanding its assets and liabilities is crucial. If a local businesses offered to sell their shop to you —after determining revenue and profit—you would be asking about the business’s debt and the value of its assets. The same principle applies when assessing publicly traded companies like Constellation Energy.
The company’s assets have remained consistently high, fluctuating between $48-50 billion USD, which is a positive sign of financial stability. Notably, its total assets exceed its liabilities and debt, indicating a strong financial position and overall good financial health. This is generally a green flag for investors, as it suggests the company has a solid foundation to support its operations.
However, as illustrated in Figure 10, a concerning trend has emerged. Over the past five years, total liabilities and debt have steadily increased, while the company’s assets have remained stagnant. This shift is a negative signal, as it suggests that the company’s financial position has weakened over time. An increasing debt burden without corresponding asset growth raises questions about how efficiently the company is managing its finances and whether it is taking on too much risk.
Additionally, Constellation Energy’s cash on hand is at a worryingly low level, especially when compared to its rising debt. This is a red flag, as it indicates the company may not be adequately prepared to handle financial downturns, unexpected expenses, or economic uncertainties. A low cash reserve limits flexibility and could force the company to take on more debt or issue new shares in difficult times, potentially diluting shareholder value.
While the company remains financially stable for now, investors should closely monitor its rising debt levels and limited cash reserves, as these factors could impact long-term financial sustainability and overall risk exposure. The most important indicator when assessing a company’s financial health is Total Shareholder Equity, which is calculated as: Total Shareholder Equity=Total Assets−Total Liabilities. As can be seen from illustration 11, its total shareholder equity has gradually decreased because of rising liabiltities something that is a red flag for potential investors and should be closely monitored.
Debt to Equity Ratio
Illustration 12: The Debt to Equity Ratio of Constellation Energy from 2019 to 2014.
The Debt-to-Equity (D/E) ratio is a key financial metric used to assess a company’s financial leverage and risk. It measures how much debt a company uses to finance its operations relative to shareholder equity. A high D/E ratio (greater than 1.0) suggests that the company relies heavily on debt financing, which can amplify financial risk, particularly during economic downturns when debt obligations may become more difficult to manage. In contrast, a low D/E ratio (below 1.0) indicates that the company is primarily financed through equity rather than debt, reducing financial risk but potentially limiting rapid expansion. A negative D/E ratio, on the other hand, signals that a company has more liabilities than equity—often considered a warning sign for investors.
Constellation Energy has a high D/E which was 3.5 in 2024, and has generally been over 3 the past 5 years which is a very high level. Constellation Energy’s D/E ratio has remained at an elevated level, meaning that the company is more dependent on debt financing rather than funding growth through retained earnings or equity. This is particularly concerning because rising interest rates and economic downturns could make it harder for the company to manage its debt burden. If Constellation continues to accumulate liabilities while its equity remains stagnant or grows at a slower pace, it could lead to higher financial strain and potential difficulties in meeting debt obligations.
A high D/E ratio is not unusual for utility companies, as they often require significant capital investment for infrastructure, maintenance, and expansion. However, when compared to competitors, Constellation’s debt levels are on the higher side, making it a riskier choice for conservative investors.
Price to earnings ratio (P/E)
Illustration 13 and 14: P/E ratio for Constellation Energy from 2019 to 2025. The P/E ratio was negative for 2021 and 2022 as the EPS was negative.
For value investors, the most important metric when evaluating a stock is the price-to-earnings (P/E) ratio, which helps determine whether a company is undervalued or overvalued. if a company has outstanding financials, buying its stock at an excessively high price can lead to poor returns. To illustrate this, imagine a local barber shop that generates solid profits. If the owner offers to sell you the business for $1, it would be an incredible dery al. However, if he tries to sell it for $1 billion, no matter how successful the shop is, the price would be absurdly overvalued. The stock market operates in a similar way—companies can be cheaply priced on some days and highly expensive on others.
In the past couple of years the P/E ratio of Constellation has been around 23-24 which is average and suggest that the company is neither undervalued nor overvalued. However, the P/E ratio of 33,77 in January 2025 can be considered high. A high P/E ratio suggests that the company’s stock is priced at a premium relative to its earnings, indicating that investors expect substantial future growth. However, such expectations may not align with the company’s actual performance, especially considering Constellation Energy’s recent financial challenges, including inconsistent earnings and rising debt levels. It’s also important to note that Constellation Energy’s P/E ratio has experienced considerable volatility. For instance, at the end of 2022, the company had a negative P/E ratio of -177, reflecting periods of negative earnings. The P/E is a negative flag and suggest that the price is too high for valueinvestors.
Dividend
The company follows a quarterly dividend payment schedule. For instance, in 2024, dividends of $0.3525 per share were declared in February, May, July, and November, with corresponding ex-dividend dates and payment dates in the subsequent months. This regularity provides investors with a predictable income stream.
Constellation Energy has demonstrated a consistent increase in its dividend payouts over the past few years. Here’s a summary of the annual dividends per share:
2024: $1.41
2023: $1.128
2022: $0.564
t’s important to note that Constellation Energy’s dividend yield remains relatively modest compared to industry averages. As of January 2025, the yield stands at 0.42%, which is lower than the typical yield for utility companies. The company’s dividend payout ratio stands at around 15.55%, suggesting that a modest portion of earnings is allocated to dividends, which may indicate potential for future increases.
In summary, Constellation Energy’s increasing dividends and consistent payment schedule are positive indicators for investors seeking stable returns. However, the yield is modest, and the company’s payout ratio is prudent. This reflects a strategy aimed at sustainable growth and financial stability, but is also bad news for dividend investors as the dividend for Constellation Energy is far lower compared to other utility companies and to the stock market as a whole.
Insider Trading
A crucial metric to consider when evaluating whether a company is worth investing in is insider trading activity—specifically, whether company insiders have been buying or selling shares over the past year. It’s particularly important to assess who has been trading, as directors should be monitored even more closely than officers.
As can be seen from the table below, there has been no selling by any insiders recently. This is a green flag for investors since it shows that insiders are confident in the company as they have not sold their shares.
Illustration 15: Most recent Constellation Energy Insider Trades
Other Company Info
As illustrated below, Constellation Energy currently employs approximately 13,871 individuals, reflecting a steady increase from 11,696 employees in 2021.The company was established in 1999 and, following a merger with Exelon in 2012, re-emerged as an independent entity in 2022 after a corporate spin-off. It is publicly traded on the NASDAQ stock exchange under the ticker symbol CEG. Operating within the Utilities sector, Constellation Energy is classified under the Multi-Utilities industry.The company has approximately 319 million shares outstanding and a market capitalization of around $95.453 billion USD.
Headquartered at 1310 Point Street, Baltimore, Maryland 21231, United States, Constellation Energy’s official website is http://www.constellationenergy.com.
Final Verdict
Constellation Energy offers an exciting opportunity for investors looking to gain exposure to nuclear and renewable energy. The company has secured high-profile business deals with Amazon and Microsoft and has contracts in place to expand its clean energy portfolio. With a strong commitment to sustainability and future-oriented investments, Constellation is well-positioned to benefit from the growing demand for carbon-free energy.
However, the company’s financial performance raises concerns. Both revenue and net income have fluctuated significantly over the past few years, and high COGS (Cost of Goods Sold) consumes a large portion of profits. Additionally, total shareholder equity has declined, as assets have remained stable while liabilities and debt have increased. These factors indicate potential financial instability and a lack of consistent profitability.
That said, it is crucial to consider that Constellation Energy only recently became an independent company, meaning the available financial data is somewhat limited. Moreover, rising liabilities are not uncommon for companies heavily investing in large-scale projects like nuclear and renewable energy. For growth-oriented investors who believe in the long-term potential of clean energy, Constellation Energy could be a compelling, albeit risky, investment. However, for value investors seeking a financially stable and undervalued company with strong past performance, Constellation Energy is not an ideal choice.
NVIDIA Corporation, founded in 1993 by Jensen Huang, Chris Malachowsky, and Curtis Priem, has transformed the tech landscape with its relentless innovation. Headquartered in Santa Clara, California, the company is renowned for pioneering graphics processing units (GPUs) that power everything from video gaming to artificial intelligence (AI) and data centers.The efficiency of accelerated computing.
As of 2025, NVIDIA holds a commanding position in the semiconductor industry. The company’s stock (NVDA) has seen significant growth, driven by demand for GPUs in AI and gaming. Despite facing competition from AMD, Intel, and emerging players, NVIDIA has maintained its edge through innovation and strategic acquisition
Challenges persist, including supply chain disruptions and regulatory scrutiny, especially after the failed acquisition of ARM due to antitrust concerns. Nevertheless, NVIDIA continues to diversify its portfolio, ensuring long-term resilience.
A Legacy in Gaming
The company’s journey began with a groundbreaking achievement in gaming technology, introducing the GeForce 256 in 1999, the world’s first GPU. This innovation revolutionized gaming by delivering real-time 3D rendering and setting new standards for graphical fidelity. Over the years, NVIDIA’s GeForce GPUs have remained dominant in the gaming industry, constantly pushing the boundaries of performance and visual quality.
Technologies like ray tracing and DLSS (Deep Learning Super Sampling) have further enhanced gaming experiences, offering realistic lighting and shadows while optimizing performance.
NVIDIA has also contributed significantly to gaming hardware through innovations like G-SYNC, which ensures smooth gameplay by eliminating screen tearing. Additionally, the company has embraced the future of gaming with GeForce NOW, a cloud-based platform that enables high-end gaming experiences on a variety of devices.
Illustration 1: The Logo of NVIDIA, an eye symbolizing constant innovation.
The AI Revolution
While NVIDIA’s roots lie in gaming, its impact on artificial intelligence has been transformative. GPUs, initially designed for rendering images, have proven to be highly efficient for parallel processing tasks required in AI and machine learning. NVIDIA’s CUDA (Compute Unified Device Architecture) platform opened the door for researchers and developers to harness GPU power for tasks like neural network training.
The launch of the NVIDIA DGX systems and A100 Tensor Core GPUs has positioned the company as a leader in AI infrastructure. These technologies are integral to advancements in autonomous vehicles, robotics, natural language processing, and more. NVIDIA’s AI-driven technologies are used by companies across industries, from healthcare to finance, enabling breakthroughs in fields like drug discovery and fraud detection.
Data Centers and the Cloud
NVIDIA has expanded its reach beyond gaming and AI into data centers and cloud computing. The acquisition of Mellanox in 2020 strengthened NVIDIA’s position in networking and high-performance computing. NVIDIA’s GPUs are now at the heart of data centers worldwide, accelerating workloads for cloud providers, enterprises, and research institutions.
The company’s software platforms, including NVIDIA Omniverse and NVIDIA AI Enterprise, enable collaboration and innovation across industries. Omniverse, a 3D simulation and collaboration platform, is particularly promising in fields like virtual production, architecture, and design.
Automotive Innovation
NVIDIA is also a key player in the race toward autonomous vehicles. Its DRIVE platform offers end-to-end solutions for self-driving cars, providing everything from AI computing hardware to simulation tools. Partnerships with major automakers and startups demonstrate NVIDIA’s commitment to reshaping transportation with safer and more efficient systems.
Supercomputing
Nvidia is at the forefront of supercomputing. Its DGX systems combine the power of multiple high-performance GPUs to create supercomputers that drive some of the world’s most significant scientific discoveries. These systems are used in diverse areas like climate modeling, genomics, and physics simulations.
In addition, Nvidia’s acquisition of Mellanox Technologies in 2020 expanded its portfolio into high-speed networking, further enhancing its capabilities in supercomputing and AI. By providing end-to-end infrastructure solutions, Nvidia has positioned itself as a key player in the future of high-performance computing.
Illustration 2: A NVIDIA GPU (Graohic Processing Unit), one of the products NVIDIA is famous for.
2. Stock Analysis
In this section we will analyze NVIDIA stock to see if it is a good stock to buy or not. Our philosophy is value investing meaning that we try to find good quality companies that are undervalued. However, we will give a holistic overview so all kind of investors with different philosophies can judge the stock for themselves.
Revenue and Profits
To determine a company’s worth and if it is worth investing in, the company’s revenue and profits are a natural starting point to analyze. It should never bee forgotten that a stock represents a company just like the small companies in your home town. If the local barber asked if you wanted to by her hairsalone, your first question would naturally be how much does this barber shop make in profits and what is its debt. Furthermore, you want to research how it’s result have been over the years to make sure that the recent profits are not part of a downwards trend or just outliers.
Illustration 3 and 4: The revenue graph of NVIDIA from 2009 to 2024.
As illustrated in the graph above, NVIDIA’s gross revenue has shown a clear upward trend. With an earnings growth rate of 24.5%, the company is experiencing rapid expansion. While past performance does not guarantee future growth, most analysts anticipate continued revenue increases, particularly given NVIDIA’s involvement in high-growth sectors such as data centers, AI, and gaming. The revenue of NVIDIA is a clear positive sign and indicates that this is a company to be invested in since it’s revenue has continuely grown for the past years and there are no indications that this will slow down.
Illustration 5 and 6: The Net Income of NVIDIA from 2009 to 2024
Net income is a crucial metric to evaluate when determining whether a company is a worthwhile investment. It represents a company’s net profit or loss after accounting for all revenues, income items, and expenses, calculated as Net Income = Revenue – Expenses.
As illustrated in Figures 5 and 6, NVIDIA’s net income has shown a consistent upward trend, demonstrating steady growth. The company has been profitable since 2011 and has continuously increased its earnings, despite a few outliers in 2020 and 2023. Overall, NVIDIA’s net profit from 2009 to 2024 presents a strong case for potential investors, as it reflects a company that is both profitable and has exhibited sustained net income growth over the past 15 years.
Revenue Breakdown
Illustration 7: NVIDIA Revemue breakdown, gathered from and made by App Economy Insights at appeconomyinsights.com
As illustrated in illustration 7, NVIDIA has many different sources of revenue including from Data Centers, Gaming industry, professional visualization, automotive and OEM. However, the two largest revenue streams comes from Data Centers and gaming, especially data centers account alone for 47,5 % while gaming account for 10,4 %.
nderstanding this revenue distribution allows investors to assess NVIDIA’s resilience, growth potential, and exposure to key industries. With AI and cloud computing experiencing rapid expansion, NVIDIA’s strong presence in data centers positions it well for sustained long-term growth.
Dividend
For potential investors, it is important to note that NVIDIA’s dividend policy reflects a company that returns very little cash to shareholders. While this might typically be seen as a negative indicator for many companies, it does not necessarily signal a drawback in NVIDIA’s case.
Fast-growing companies often choose not to pay significant dividends, instead reinvesting their profits into expansion and innovation. NVIDIA follows this strategy, demonstrating confidence in its long-term growth potential. Rather than distributing earnings to shareholders, the company prioritizes strengthening its leadership in high-growth industries such as AI, gaming, and data centers.
This reinvestment strategy suggests that NVIDIA is committed to accelerating its competitive edge and maintaining its market dominance. The combination of minimal dividends and strong stock price appreciation makes NVIDIA particularly appealing to growth-oriented investors who prioritize long-term capital gains over immediate income. While income-focused investors may look elsewhere, those seeking exposure to a rapidly expanding technology leader may find NVIDIA an attractive addition to their portfolios.
Assets & Liabilities
Illustration 8 and 9: The total assets and liabilities of NVIDIA.
When evaluating a company as a potential investment, understanding its assets and liabilities is crucial. If a local barber offered to sell their shop, one of the first questions you would ask—after determining revenue and profit—would be about the business’s debt and the value of its assets. The same principle applies when assessing publicly traded companies like NVIDIA.
As shown in Illustrations 8 and 9, NVIDIA’s total assets have demonstrated a consistent upward trend, increasing from $3,351 million in 2009 to $65,728 million in 2024. A significant portion of these assets consists of cash on hand, which includes cash deposits at financial institutions and highly liquid short-term investments maturing within a year. This strong liquidity position means that NVIDIA is well-equipped to handle economic downturns or unforeseen crises, ensuring financial stability and the ability to seize new investment opportunities when needed.
As NVIDIA has grown, its total liabilities have also increased, which is a natural occurrence for expanding companies. However, a particularly notable feature in NVIDIA’s financials is the decline in long-term debt from 2022 to 2024. This reflects the company’s strong financial position, as it has been able to reduce its long-term obligations while continuing to grow.
The most important indicator when assessing a company’s financial health is Total Shareholder Equity, which is calculated as: Total Shareholder Equity=Total Assets−Total Liabilities.
This metric represents the company’s net worth, and if it is increasing, it signals that the company is becoming more valuable over time. As seen in Illustration 9, NVIDIA’s shareholder equity has grown from $2,395 million in 2009 to $42,978 million in 2024, a strong indication of financial strength and sustained growth.
Over the past 15 years, NVIDIA has built a solid financial foundation with steadily increasing assets, declining long-term debt, and strong shareholder equity growth. The company’s significant cash reserves further reinforce its ability to navigate potential economic challenges. With assets far exceeding liabilities, NVIDIA is in an exceptionally strong financial position, making it an attractive investment for those seeking stability and long-term growth.
Illustration 10: Earning per Share of NVIDIA from 2009 to 2024
Other key financial metrics also highlight NVIDIA’s strong financial health and positive development. One of the most important indicators of a company’s profitability is Earnings Per Share (EPS), which measures how much profit is allocated to each outstanding share of common stock. Investors and analysts use EPS to gauge a company’s financial performance and growth potential.
As illustrated in Figure 10, NVIDIA’s EPS has shown a clear upward trend from 2009 to 2015 and has remained consistently positive since 2011. This sustained growth in EPS signals that NVIDIA is generating increasing profits per share, reinforcing its strong financial position and solid profitability.
For investors, a rising EPS is generally considered a green flag, as it indicates that the company is successfully growing earnings while maintaining financial stability. NVIDIA’s positive EPS trajectory supports the case for its long-term growth potential, making it an attractive prospect for investors looking for profitable and well-managed companies.
Illustration 11 and 12 : Debt to equity ratio of NVIDIA from 2009 to 2024
The Debt-to-Equity (D/E) ratio is a key financial metric used to assess a company’s financial leverage and risk. It measures how much debt a company uses to finance its operations relative to shareholder equity. A high D/E ratio (greater than 1.0) suggests that the company relies heavily on debt financing, which can amplify financial risk, particularly during economic downturns when debt obligations may become more difficult to manage. In contrast, a low D/E ratio (below 1.0) indicates that the company is primarily financed through equity rather than debt, reducing financial risk but potentially limiting rapid expansion. A negative D/E ratio, on the other hand, signals that a company has more liabilities than equity—often considered a warning sign for investors.
Legendary value investors like Warren Buffett favor companies with a D/E ratio below 0.5, meaning they have at least twice as much equity as debt. Buffett avoids companies with excessive debt since high interest payments can erode profits, particularly in periods of economic instability. Additionally, he prioritizes businesses that maintain a stable or declining D/E ratio over time rather than those that take on large amounts of debt unexpectedly.
As illustrated in Figures 11 and 12, NVIDIA’s D/E ratio has remained consistently low and has now fallen below 0.5—a remarkable achievement for a high-growth company. Typically, growth-oriented firms rely on significant debt to finance rapid expansion, but NVIDIA has managed to grow without overleveraging itself. Furthermore, the company has never recorded a negative D/E ratio, reinforcing its financial stability and making it an attractive option for risk-conscious investors.
Price to earnings ratio
Illustration 12 and 13: The P/E ratio of NVIDIA
For value investors, the most important metric when evaluating a stock is the price-to-earnings (P/E) ratio, which helps determine whether a company is undervalued or overvalued. Even if a company has outstanding financials, buying its stock at an excessively high price can lead to poor returns. To illustrate this, imagine a local barber shop that generates solid profits. If the owner offers to sell you the business for $1, it would be an incredible deal. However, if he tries to sell it for $1 billion, no matter how successful the shop is, the price would be absurdly overvalued. The stock market operates in a similar way—companies can be cheaply priced on some days and highly expensive on others.
Currently, NVIDIA has a P/E ratio of 52.24, which is considered very high. To put this into perspective, legendary value investor Warren Buffett typically considers stocks with a P/E ratio of 15 or lower to be “bargains.” A high P/E ratio suggests that investors are paying a premium for the company’s earnings, potentially expecting significant growth. However, it also means that the stock is far more expensive compared to its earnings, which can be a red flag for value investors. The elevated P/E ratio of 52.24 indicates that NVIDIA is trading at a premium and may be overpriced based on traditional valuation metrics. This could pose a risk for investors, as the stock might struggle to sustain such high expectations. If NVIDIA fails to deliver on its projected growth, the stock price could face significant downward pressure.
While NVIDIA is a strong and innovative company, value investors may hesitate to buy at these valuation levels. Buying stocks at the right price is just as important as picking the right companies. At a P/E ratio this high, NVIDIA may not fit within a classic value investor’s strategy and could be considered overvalued in the current market.
Insider Trading
A crucial metric to consider when evaluating whether a company is worth investing in is insider trading activity—specifically, whether company insiders have been buying or selling shares over the past year. It’s particularly important to assess who has been trading, as directors should be monitored even more closely than officers.
As shown below, there has been significant insider selling, which is a major red flag. Notably, this selling includes transactions from directors and even the CEO, raising serious concerns. Such activity could indicate that insiders anticipate weaker financial performance, expect the stock price to decline, or believe the stock is overvalued—a concern that aligns with the valuation analysis above.
If those inside the company lack confidence in its future, why should outside investors? See Illustration 14 below for a detailed record of the latest insider transactions.
Illustration 14: Full list of all newest insider trades by NVIDIA officials.
Other Company Info
As illustrated below, NVIDIA currently have 29,6 thousands employees which showcases the company’s huge growth as it only had 8,8 thousands employees in 2014. The company itself was founded in 1993, it has the ticker NVDA and is listed on the NasdaqGS exchange. Its industry is officially semiconductors and it has 24.49 billion shares outstanding.
NVIDIA’s headquarters are at 2788 San Tomas Expressway, Santa Clara, California, 95051, United States of America as can be seen below-
Illustration 15-17: Number of employees at NVIDIA and its location.
Final Verdict
In conclusion, NVIDIA is a solid company with impressive growth potential, operating in high-demand sectors such as data centers, AI, and automation, all of which are poised for substantial expansion in the coming years. The company has consistently demonstrated its ability to grow, backed by a strong historical earnings record. Its financials are robust, with ample assets and cash reserves, and its shareholder equity remains positively strong. Additionally, its EPS is healthy, reflecting solid profitability.
That said, for value investors, I would caution against purchasing NVIDIA stock at this time. The stock appears overvalued based on current market conditions. Moreover, there is a significant amount of insider selling, which raises concerns. This selling could indicate that insiders believe the stock is overpriced and are capitalizing on the opportunity, or it could suggest underlying factors that are not yet publicly known but might signal potential risks ahead.
Starting a business is a very exciting adventure. However, it comes with its share of challenges, particularly in the early stages. ne of the most crucial aspects of building and sustaining a successful business is maintaining a consistent supply of high-quality goods or services. Reliable supply chains are the lifeblood of any business and play a vital role in avoiding financial pitfalls and bankruptcy. For new entrepreneurs, identifying the right suppliers can feel overwhelming. This article is meant to serve as a step-by-step guide to help you discover, evaluate, and build strong partnerships with dependable suppliers and manufacturers.
Image 1: A manufacturer producing microchips, highlighting the complexities of manufacturing products.
Once an entrepreneur has decided on a product to sell—such as for example watches—they must determine how to source that product. One option is to produce it themselves. However, as products become increasingly complex, and since most people lack the expertise or resources to manufacture everything on their own, entrepreneurs often need to find a cost-effective source for their goods. This is where manufacturers play a crucial role.
A manufacturer is a company that converts raw materials into finished products. These products are then sold to consumers, wholesalers, distributors, retailers, or even other manufacturers to create more complex items. Many manufacturers focus on a specific type of product to improve efficiency and reduce costs. For example, you might collaborate with:
A toy manufacturer for creating toys;
A electronics manufacturer for creating cameras;
A food manufacturer for making cookies;
etc.
Working with multiple suppliersand manufacturers
A key piece of advice for businesses is not to limit yourself to working with just one manufacturer. Partnering with multiple manufacturers can help you diversify your inventory, create a unique product mix, and establish a safety net in case of delays or contract issues. This strategy, known as supplier diversity, is an effective way to mitigate supply chain risks.
A smart approach is to secure two manufacturers: one domestic and one international. The domestic manufacturer can act as a backup, ensuring stock availability and customer satisfaction if issues arise with international orders, such as delays or errors. While domestic suppliers may be more expensive, they offer reliability and quick response times, which can be invaluable during disruptions in your foreign supply chain.
Image 2: A manufacturer specialized in creating watches.
How to find a manufacturer
Now, you’re probably wondering how to find the right manufacturer. Ideally, you want a partner who can deliver high-quality products at a low cost, with minimal shipping times, and with whom you can establish a strong business relationship. Poor-quality or overpriced products can jeopardize your business, potentially leading to financial failure. Similarly, strained relationships with manufacturers can cause significant headaches and, in the worst cases, legal disputes.
This article will now guide you step by step through the entire process of finding the perfect manufacturer for your business needs.
Step 1- Identify all potential suppliers
The first step is to identify and map out all potential manufacturers.To make an informed decision about which manufacturer to choose, you must first research and determine which manufacturers are available and suitable for your needs. Here are the most essential tools to assist you in your search:
Google: Begin with a straightforward Google search for “manufacturers near me” to identify local options. Examine their websites, customer feedback, and areas of expertise to evaluate their fit for your requirements. You can also search for manufacturers in google maps to see which ones are closest to you.
Image 3: Google maps can be a business owner’s most essential tool.
Helpful tip: Supplier websites are often outdated or lacking in detailed information. Use a variety of search terms, such as ‘wholesale,’ ‘supplier,’ and ‘distributor,’ to expand your search. Additionally, take advantage of Google’s advanced search features to refine and improve your results.
Referrals: One of the most important ways to find potential suppliers is through your network. Don’t hesitate to:
Seek supplier recommendations from your professional network;
Connect with successful entrepreneurs in your industry for guidance, and
Participate in Facebook groups and online e-commerce communities to gather reviews and suggestions.
Suppliers who aren’t a perfect fit may still guide you to the right connections. Industry experts often have access to a network of trusted contacts, so be sure to ask for recommendations when reaching out.
NAICS codes: The North American Industry Classification System (NAICS) assigns specific codes to manufacturers and products, making it easier to find suppliers, particularly in professional directories. Refer to the NAICS codes for the United States and Canada to simplify your search.
Once you’ve shortlisted your options, it’s crucial to conduct a thorough background check on potential manufacturers. Review the Better Business Bureau (BBB) for any complaints and explore customer feedback to confirm their reputation and reliability
Alibaba: Alibaba is a well-known platform that connects you with manufacturers, mainly from China. You can use it to discover existing products or find manufacturers for custom creations. Alibaba is the place most businesses find their manufacturer. You can search for your product there and find potential suppliers. You can filter potential manufacturer by country, price, etc.
Image 4: Alibaba is a great way to connect with suppliers.
When researching manufacturers on Alibaba, look for these qualifications:
Gold supplier status (they pay for Alibaba membership)
Verified status (a third-party evaluation services company or Alibaba has visited their facility)
Trade shows bring businesses together to showcase their latest products and services, often taking place over several days in convention centers across major cities. In addition to large-scale events, there are also smaller, regional trade shows that highlight local businesses. These events offer valuable opportunities to experience products in person, connect with business owners, and discover fresh ideas and trends that could inspire new product developments
Trade assurance (free service protecting your orders from payment to delivery)
When looking for manufacturers, consider using filters to identify those with certifications like SA8000, which ensures humane working conditions, if this aligns with your business values. It’s essential to confirm you’re engaging directly with manufacturers, not intermediaries or trading companies, as this can lead to higher costs. Opting for a manufacturer with a track record of at least five years can also help mitigate the risk of financial instability and ensure a more reliable partnership.
Figure 5: Searching manufacturing directories can be a good way to find manufacturers.
Manufacturing directories: Online supplier directories are another valuable resource. These catalogs offer the profiles of thousands of manufacturers, wholesalers, and suppliers. Here are some popular options:
Overseas manufacturing, particularly in countries like India, China, and Vietnam, often offers lower costs. According to U.S. News & World Report, these three countries ranked as having the cheapest overseas manufacturing costs. However, consider factors beyond just price when making your decision.
Step 2 – Research your potential manufacturers
Once you’ve identified potential manufacturers, it’s time to request quotes. Aim for at least three quotes to effectively compare your options. For local manufacturers, consider scheduling a tour of their facilities or visiting their office to observe their operations firsthand. This will give you insight into product quality and overall processes. Additionally, explore other manufacturers in the same country that may not be listed online.
Figure 6: It is a pro-tip to travel to to and visit the manufacturer.
Even if the manufacturer is located in another country, such as in Asia, it can still be extremely valuable to visit their operations in person. Traveling to see the facility firsthand allows you to assess product quality, understand the processes, and build relationships with the factory leadership. The leaders of several of the largest fortune 500 companies started off by visiting a factory to find the right products.
An example of this can be Nike founder Phill Knight that started his business by traveling to Japan in his quest for finding the perfect shoe manufacturer.
Beyond pricing, here are key questions to ask:
Can they handle custom orders? Assess whether they have the skills, resources, and automation features to create your specific product.
What are their lead times? Ensure they can deliver products quickly enough to keep your customers happy and your inventory stocked.
What are the shipping costs? Shipping is a significant expense for small businesses.
What are their minimum order quantities (MOQs)? While it’s best not to lead with this question, you’ll need to know the minimum number of items required for production. Remember, this is often negotiable!! Do not get intimidated if they have a high number of MOQs on their website.
What’s the cost per unit? Negotiate this alongside MOQs. Generally, larger orders can lead to lower per-unit costs.
Can they offer exclusivity? If you’re investing in tooling, ensure they won’t allow others to use it. You might also explore territorial, market, or total exclusivity options, or even private label goods.
Are there setup fees? Some manufacturers charge fees to prepare equipment for your production run.
What’s their defect policy? Clarify who covers the cost for incorrect or defective items, including shipping and duties.
Is the manufacturer sustainable and ethical? Inquire about factory conditions and their impact on workers and the environment.
Compare prices: Even if you’ve found a supplier with high-quality products and a strong reputation, it’s important to ensure their prices remain competitive. For startups with limited business experience, comparing prices from different suppliers can help you gauge the average cost of the materials you need. It’s wise to continue this practice even after selecting a supplier to ensure you consistently get the best prices for your products.
Even if you already have a supplier, it’s still smart to regularly compare your supplier’s prices to the prices of their competitors. By doing this, you’ll ensure that you’re always paying the minimum you need to for your supplies, which is an excellent way to cut costs in a small busines
Tips to negotiating effectively is to:
Understand the reason behind the supplier’s minimum. Is it due to upfront work? Do they prefer larger buyers?
Use this understanding to propose a compelling counter-offer.
If a foreign manufacturer: learn about the culture and business traditions in the country before you send them a message/e-mail it will make them respond more positivly.
Many suppliers ask new businesses to pay for full orders upfront, which is important to consider, as inventory costs can be significant for e-commerce businesses. Be sure to inquire about payment terms for future orders as well. However, many reputable manufacturers are open to negotiating these terms. One option is to propose a 50/50 payment split: 50% upfront and 50% upon receiving the shipment. This approach helps balance the risk for both parties.
Figure 7: Communication and negotiation with the manufacturer is an unavoidable part of the process and therefore essential
Suppliers often receive many quote requests, which can result in delayed responses or even ignored emails. If you’re uncertain about your request, consider making a quick phone call or sending a brief email with a single question to clarify before submitting a full inquiry.
When launching your online business, you’ll probably manage communication with manufacturers yourself, using phone, email, or text. For local manufacturers, in-person meetings are also an option. Choose trading companies that are responsive and proactive in working with you. If a potential partner is slow to reply or reluctant to send samples, they might not be the right fit for your business.
Your initial email should be clear and concise, focusing on assessing the potential fit with the supplier. Highlight key details that matter most to suppliers, such as sourcing information.
While it’s important to inquire about pricing for various quantities, avoid bombarding them with too many questions. Keep the message focused on essential information.
Step 3 – Customize and design your product
After your initial discussions with potential manufacturers, it’s time to share your product design. While some manufacturers offer product development services, including prototyping and 3D modeling, these can be expensive. Consider alternative ways to communicate your ideas, such as:
Sketches
Written instructions
Reference photos
Figure 8: Creating a customized design is essential.
If your chosen manufacturer doesn’t offer design services, you can turn to freelancers on platforms like Fiverr or Upwork for professional design work. Consider hiring:
Industrial designers
Product designers
CAD (computer-aided design) specialists
Consider working with a local designer for prototypes and custom molds, which may be more cost-effective than using a manufacturer.
Private label products involve manufacturers creating a customized version of an existing product just for your business. Depending on the manufacturer and product, you can request unique branding, materials, ingredients, and features to make your product stand out. Customers often favor private labels, and adding your logo is a powerful way to build your brand identity.
Step 4 – Request samples from suppliers and assess their quality.
A business’s reputation depends on the quality of its products. Poor-quality goods from suppliers can harm your reputation when sold. To avoid this, always request a sample before making a large purchase and moving into full production. Once satisfied, date and sign the sample, and keep one or two as control references.
Control samples act as a quality assurance tool to ensure product consistency. For instance, if a shipment arrives with incorrect colors, you can use the control sample to highlight the discrepancy
A sample is typically a single unit of the desired product, allowing you to test its quality. While some suppliers offer free samples, others may require payment.
If a supplier refuses to provide samples, even for a fee, consider working with them on a trial basis. However, proceed with caution and keep a few key considerations in mind.
Start small when testing a new supplier. Instead of filling your entire inventory, purchase a limited quantity—such as a week’s worth of materials rather than a month’s supply. This way, if the supplier doesn’t meet your expectations, you won’t be left with a large stock of low-quality products.
Only consider using a supplier on a trial basis if they appear trustworthy and reliable in other aspects. If their prices are competitive and they have a strong reputation, it’s likely safe to proceed without a sample. However, if you can’t obtain samples and have little information about the supplier, testing them could lead to more issues than benefits..
Step 5 – Place your order
Even after receiving samples, there’s still room to negotiate terms on payment or MOQ. When negotiating: Focus on building a long-term, healthy supplier relationship and consider the manufacturer’s perspective.
Remember, the goal isn’t to exploit your manufacturing partner for the lowest price, but to create a mutually beneficial partnership.Remember, the goal isn’t to exploit your manufacturing partner for the lowest price, but to create a mutually beneficial partnership.
Make sure to hold a high standard and be professional in your contact with the manufacturer as to not seem as an unserious business.
When everything is done, dont forget to place your order.
Important factors to keep in Mind
The impact of quality on pricing
Premium materials, like switching from cotton to cashmere in apparel production, typically come with higher costs. While these materials can enhance a product’s perceived value, they require a larger upfront investment, leading to a longer wait to recover costs through sales.
Figure 9: Silk which is a high-quality product.
Balancing cost savings with product durability
Non-durable products may affect customer satisfaction but can drive repeat business. Durable products, while commanding higher prices, last longer but are more costly to source. Market research can help you understand the importance of durability to your target audience. For example budget-conscious customers may prefer a $5 umbrella that lasts one season while high-income clients may invest in premium, long-lasting items
Identifying hidden costs in manufacturing
The initial quote from your supplier is just a starting point. Be aware of possible extra costs, particularly when working with overseas manufacturers or wholesale suppliers, including:
International shipping, including customs duties and tariffs, currency exchange rates, third-party quality control or inspection checks, rework and defect costs if the original sample isn’t up to standard and expenses for custom molds or machines
Future trends in manufacturing
Personalized production
Mass customization tailors products to individual preferences at scale, unlike mass production. McKinsey research shows companies excelling in personalization generate 40% more revenue than average, a trend also seen in manufacturing.
Manufacturers can fulfill complex customer orders using technologies like 3D printing, robotics, and data analytics. This allows for flexibility and agility in production without excessive costs. As consumer demand for personalized products grows, manufacturers who adapt will gain a competitive advantage.
Increased use of biomanufacturing
Biomanufacturing, also known as bioprocessing or biotechnology manufacturing, utilizes biological systems like cells or microorganisms to produce products such as pharmaceuticals, biofuels, food, and cosmetics.
The main benefit of biomanufacturing is its sustainability. Biomanufacturing is sustainable, using renewable resources instead of fossil fuels and generating fewer emissions. It also enables the production of complex molecules and materials that traditional methods can’t synthesize.
This manufacturing method will be especially important in fast-paced industries with fluctuating demand or evolving product needs. The biomanufacturing market is already growing, expected to reach over $85 billion, up from $18 billion in 2020.
Figure 10: A company using biomanufacturing as an alternative way to produce products.
Servitization
Servitization enables manufacturers to boost revenue by offering services alongside traditional manufacturing. These can include aftermarket goods, maintenance services, training, and customer support agreements.
By embracing servitization, manufacturers can foster stronger, more profitable customer relationships and create new recurring revenue streams. This trend is especially relevant in industries with long product life cycles, like machinery, equipment, and vehicles
Smart Factories
A recent Deloitte survey highlights smart factories as a key priority for manufacturers in 2024. Amid rising costs and economic uncertainty, 83% of manufacturers believe smart factory solutions will transform production in the next five years. These factories use IoT, AI, and machine learning to optimize processes, reduce downtime, and improve efficiency. As competition grows, smart factories are likely to become the industry standard.
Figure 11: The use of AI for manufacturing is a trend that will continue.
Social Media
Mastering social media has become essential for businesses, as it offers a powerful tool for reaching and engaging with potential customers. Online influencers, using platforms beyond just LinkedIn and blogs, can recommend specific vendors to their audience, driving traffic and sales. This is often done through links to eCommerce websites or stores on platforms like Shopify.
Influencers can be compensated in two main ways: they may receive upfront payment as partners of the sponsoring vendor or earn commissions as affiliates for each purchase made through their referral links. This strategy allows businesses to tap into the influencer’s network, boosting visibility and sales, especially in a digital-first world.
Selecting the right name for your company is a critical step in establishing its identity and making a lasting impression on your target audience. A well-thought-out name can convey your brand’s values, personality, and purpose. To guide you through this important decision-making process, here are some key considerations to keep in mind when choosing a name for your company.
Reflect Your Brand Identity
The essence of your brand should be reflected in the name of the company. Consider the products or services you offer, your company’s mission, and the values you want to communicate. A name that aligns with these aspects helps create a cohesive and meaningful brand identity.
Questions to think about when trying to find the essence/spirit of the company are- Is the name edgy? Classic? Is it something that will match your company’s overall theme? what is your company about and what you are planning to achieve through it? Get the feeling of what your products are , i.e. ,what is your brand DNA? What are you providing your customer with ? what is your brand equity ?How you want to project your company in the market I.e. brand image? And to make sure that your customer gets the same message. I.e. brand image = brand identity?
Once you have a general idea of what you want your company to be about, start brainstorming possible names. Write down as many as you can and then choose the ones that interest you the most. A good idea is to make it short (preferable only two words).
2. Keep it Simple and Memorable
Choose a name that is easy to spell, pronounce, and remember. A simple and memorable name will make it easier for customers to recall and share with others. Avoid overly complex or lengthy names that may be challenging for people to remember or type into search engines.
This means that it would be important to consider SEO, as the company name would dictate the domain, and keywords in the long term. Questions to think about are- Do you think your potential brand name will catch people’s attention and stick in their minds? Does the name sound good, or is it fun to hear and say? Is it visually appealing?
3. Consider Your Target Audience
Think about your target demographic and what appeals to them. A name that resonates with your audience can create a stronger connection and make your brand more relatable. Make sure to reflect on what the preferences and expectations of your potential customers are. Have a clear idea of exactly what message you want to send, and whom you want your brand to resonate with. This will help you first choose a style (preeminent, playful, pragmatic, modern, intriguing, powerful).
For example, if you are selling consumer-based products, and your target consumers are millennials or generations Y or Z, you will have a bit more flexibility to think outside the box with intriguing names. However, if you are a corporate company aiming for baby boomers, you’d be smart to choose something more classic like Zenith Capital.
Before brainstorming name ideas, write down some traits that are unique to your brand. Many startups make the mistake of explaining their features or business in the name. This leads to boring and dull names.
Visualize the key ideas-The next step is to come up with the different ideas and images to convey in your name which are inherently linked to your brand. Instead of focusing on the descriptive element — i.e., what you sell — focus on expressing one or two other core concepts that are essential to your brand, culture and values.
For example, if you are a food-delivery startup, your ideas could convey images of healthy living, ethically sourced products or great customer service and quick delivery time. Keep in mind that your name is only as strong as your brand. Your brand is only as strong as the experience you deliver to people. How well you set and meet expectations plays a big role in the experience people have with your brand.
The trick is to dentify the emotions you want to evoke in people. Brainstorm names around those themes. What symbols and words represent such things? Personally I like to think around words that are associated to the feelings, and aspirations of what the product I’m selling gives my customers rather than the product itself. Side note – make sure people know what it is without you having to spell it.
4. Check Availability and legal implications
Before finalizing a name, ensure that it is legally available and doesn’t infringe on existing trademarks or copyrights. Also make sure to check for all social media channels, and domain names to make sure the name does not constitute an infringement. A thorough search can help you avoid legal complications down the road. Check domain name availability as well, especially if you plan to have an online presence.
Once you have your style, themes, and purpose clearly laid out, it’s time to really start experimenting. But before trying out different names, you should know which areas to avoid. With so many trademarks out there, the freedom to use almost any particular English word is becoming slim. The common danger zones are: Single English words, Power words — like force, united, omni, icon,. Symbolic words – like bridge, spring, sage, rocket.
The Harvard Law Review did a study recently titled Are We Running Out of Trademarks? which found that more than 70% of common English words have already been trademarked. This supports the idea that literal name are hard to trademark.
But just because you can’t use one stand-alone word doesn’t mean you can’t combine these words into something original. Transmutations are a possiblity like Zappos or Zumba. This and that names like – Haute and Bold are another possibility. Compound names like SnapChat and WordPress or Visual Story like Red Bull can all be different ways to find a name that is not taken.
While compounds and transmutations are great, you should say the words out loud to make sure they stay within the following three guidelines: Is the name easy to say? It should roll off the tongue, rather than twist it. Is the name easy to hear? Consumers should be able to hear your brand name then quickly type it into Google to find you. Is the name easy to spell? Simple misspellings such as Flickr, Xero and Lyft are much easier to trademark, but if they are hard to spell, problems could result.
Usually, you want to avoid very literal names (books.com) because it is extremely limiting and short-sighted. It’s very hard to enforce the trademark as well. You usually want a name that you can build into a brand that can go anywhere (Amazon). If you live in Norway chech out Navnesok.no
5. Scalability and Flexibility:
Make sure that the name you choose can grow with your business meaning that it will not be affected by future expansions, changes in product offerings, or potential shifts in your target market. A name that is too niche or limiting may hinder your company’s growth in the long run.
If your company operates internationally or plans to do so in the future, be mindful of linguistic and cultural nuances. A word that mean one thing in one language does not necessarily mean the same in another and also ensure that your chosen name doesn’t have a negative connotation or meaning in other languages and cultures.
Choose a name that has longevity. Trends come and go, so selecting a name based on the latest fad may not serve your company well in the long run. Aim for a timeless and enduring name that will withstand the test of time
6. Differentiate from Competitors:
Stand out in the market by selecting a name that distinguishes your company from competitors. Avoid generic terms that could easily be confused with other businesses. A unique name helps create a strong brand identity and fosters recognition.
7. Test the Waters:
Before making a final decision, gather feedback from potential customers, colleagues, and friends. Conduct surveys or focus groups to gauge the initial reactions to the name options you’re considering. This feedback can provid
8. Inspiration:
Ideas to draw inspiration from when choosing a brand name:
Predatory animals/animals in general
Geographical locations/Regions
Some type of rock or stone
Historical Figures/Civilizations
CEO Name or initials
Ancient mythology or words for example greek mythology
Some type of castle or fort
Character or place from books/Stories or shows
Bodies of water or bridges
9. Types of brands:
Descriptive names are names that explicitly convey the product offered by the company. Advantage of descriptive names are that it clearly conveys what kind of business it is and what the core competency of the company is..
Even though, descriptive names can feel somewhat boring, there are plenty of companies who have been able to be succesfull with a descriptive name.
Examples of such companies include: Toys R Us, E*Trade, General Motors, YouSendIt, The Weather Channel,Hotels.com, Bank of America, The Body Shop, Whole Foods, Holiday Inn, The Container Store, Vitamin Water,Booking.com
Evocative names are names that use suggestion and/or metaphor to convey the spirit/essence of the company. Some of the best brand names are evocative names because they enable a company to tell a powerful story about an idea that’s bigger than just the products or services they sell.
Another advantage of evocative names are that they are generally easier to trademark than descriptive names (although, it’s getting harder and harder to find an existing word that isn’t already trademarked in a given industry.)
Examples of Evocative company names include:Nike,Amazon, Virgin,Apple, Lush, Uber, Dove
Invented names are made up names that are truely unique. Because the search for an invented name isn’t confined to a finite set of existing words, this naming type offers the broadest creative territory when naming your company or product. But that doesn’t mean a good invented name is easy to create.
Inventing a name that sounds like a real word and has some semblance of meaning can be hard. This is why most invented names evolve from common root origins (Latin or Greek), are actually portmanteaus (a combination of two or more words), or are intentional misspellings that leverage the meaning of an existing word. Invented names are usually a breeze to trademark, but the more unique they are, the more time and money you will need to spend to create a meaningful brand story around them.
There is, however, plenty of famous companies that have uses invented names. Examples include: Exxon, Kodak, Xerox, Verizon, Adidas, Google, Pixar, Rolex, Spotify, Lyft and Flickr.
Lexical names are names that rely on wordplay for their memorability. Puns, phrases, compound words, alliteration, onomatopoeia, intentional misspellings, and foreign words are all styles of this popular naming type.Lexical names are often clever—sometimes too clever—and get their impact from pairing words for linguistic effect.
This naming type has been used to great effect by consumer brands in industries like snack food, pet supplies, and restaurants. It’s a style well-suited for playful brands in fun-loving spaces. When it comes to corporate branding, you won’t find many serious B2B brands whose names fall into the lexical category.
This is a great example of knowing which naming type is best suited for the brand you’re looking to build and the competitive landscape in which you operate. Lexical brand names also risk feeling a bit dated, regardless of which industry they’re in. Unless you can come up with a world-class pun that’s never been used before, today’s customer is more likely to roll their eyes than open their wallets when encountering a lexical brand name in the modern market. Lexical brand name examples include: Dunkin’ Donuts, Krazy Glue, Sizzler Steakhouse, Krispy Kreme, Froot Loops, Dribbble, Laffy Taffy, Whiskas, Mello Yello, Cheez Whiz and Hubba Bubba.
Acronyms are abbreviations formed from inital letters. there are obvious challenges with an acronymic brand name. A combination of letters does not, in and of itself, have the same meaning as the words it signifies. It can reference those words, but only if your audience knows what they are. (How many people stopped on the street could actually tell you what the letters AT&T or IBM stand for?).
Instead, acronyms usually take function as essentially invented names. Whatever meaning they have is the result of years of branding and marketing, not of the words they signify. Over their decades in existence, brands like BMW and CVS have invested millions of dollars in both brand positioning and brand design to imbue these letters with trust and credibility. A startup these days would be hard-pressed to come up with a great reason to name their company with an acronym, though. As a rule, acronyms are difficult for audiences to remember and even harder for attorneys to trademark. Acronymic brand name examples include: IBM, BP, UPS, BMW, MTV, GEICO, HP, H&M, P&G, AT&T, CVS and BBC.
Steve Jobs, the co-founder of Apple Inc., is one of the most iconic figures in the world of technology and business. His life story is often described as a classic example of going from rags to riches. Born in San Francisco on February 24, 1955, to two University of Wisconsin graduate students, Joanne Schieble and Abdulfattah Jandali, Steve Jobs faced numerous challenges and setbacks throughout his life, but he eventually rose to become a billionaire and one of the most influential innovators of the 21st century. This article will delve into the remarkable journey of Steve Jobs from his humble beginnings to his extraordinary success.
Early Life and Adoption
Steven Paul Jobs was born in San Francasico on February 24, 1955, to Joanne Carole Schieble and Abdulfattah Jandali. Abdulfattah was born in a wealthy muslim Syrian family. He obtained his undergraduate degree at American University of Beirut and pursued a PhD in political science at the University of Wiconsin. There, he met Joanne Schieble, an American Catholic of German descent whose parents owned a mink farm and real estate. The two fell in love but faced opposition from Schieble’s father due to Jandali’s Muslim faith. Steve Jobs’ life began with a turbulent start as shortly after his birth, Joanne Schieble and Abdulfattah Jandali decided to put him up for adoption. Schieble requested that her son be adopted by college graduates. A lawyer and his wife were selected, but they withdrew after discovering that the baby was a boy, so Jobs was instead adopted by Paul Reinhold and Clara (née Hagopian) Jobs. Paul and Clara Jobs, working-class couple from Mountain View, California ended up adopting him. This marked the beginning of Steve Jobs’ upbringing in a modest and middle-class family, setting the stage for his journey from rags to riches.
Figure 1: Steve Jobs childhood house in Palo Alto where Apple was founded in the garage
Childhood an Early Interests
Jobs had difficulty functioning in a traditional classroom, tended to resist authority figures, frequently misbehaved, and was suspended a few times. Clara had taught him to read as a toddler, and Jobs stated that he was “pretty bored in school and [had] turned into a little terror… you should have seen us in the third grade, we basically destroyed the teacher”. His father Paul (who was abused as a child) never reprimanded him, however, and instead blamed the school for not challenging his brilliant son. As a child, Steve showed an early interest in electronics, often tinkering with household appliances alongside his adoptive father, Paul Jobs. This early exposure to technology and innovation would prove to be crucial in shaping his future. His parents encouraged his curiosity and even bought him his first chemistry set
. When he was 13, in 1968, Jobs was given a summer job by Bill Hewlett (of Hewlett-Packard) after Jobs cold-called him to ask for parts for an electronics project.
In high school Jobs developed two different interests: electronics and literature. Jobs later noted to his official biographer that “I started to listen to music a whole lot, and I started to read more outside of just science and technology—Shakespare, Plato. I loved King Lear… when I was a senior I had this phenomenal AP English Class.” In 1971, after Wozniak his best friend began attending University of California, Berkley, Jobs would visit him there a few times a week. This experience led him to study in nearby Stanford University’s student union. Instead of joining the electronics club, Jobs put on light shows with a friend for Homestead’s avant-grade jazz program. H
Figure 2: Steve Jobs High School Picture
e was described by a high school classmate as “kind of brain and kind of hippie … but he never fit into either group. He was smart enough to be a nerd, but wasn’t nerdy. And he was too intellectual for the hippies, who just wanted to get wasted all the time. He was kind of an outsider. In high school everything revolved around what group you were in, and if you weren’t in a carefully defined group, you weren’t anybody. He was an individual, in a world where individuality was suspect.”
Education and early exposure to Technology
After completing high school, Jobs enrolled at Reed College in Portland, Oregon. However, he found the formal education system uninspiring and dropped out after just six months. He also said he dropped out because he did not want to spend his parents’ money on an education that seemed meaningless to him. He continued to attend by auditing his classes, including a course on calligraphy. In a 2005 commencement speech at Stanford University, Jobs stated that during this period, he slept on the floor in friends’ dorm rooms, returned coca cola bottles for food money, and got weekly free meals at the local Hare Krishna temple. In that same speech, Jobs said: “If I had never dropped in on that single Calligraphy course in college, the Mac would have never had multiple typefaces proportionally spaced fonts Instead. This meant that this seemingly unrelated calligraphy course later influence the design and aesthetics of Apple products, demonstrating his unique ability to connect seemingly unrelated dots.
In 1974, Steve Jobs returned to California and began attending meetings of the Homebrew Computer Club with his friend, Steve Wozniak. The club was a gathering of technology enthusiasts and hobbyists, and it was at these meetings that Jobs and Wozniak were exposed to the world of early personal computing. It was here that they first conceptualized the idea of building and selling personal computers.
Figure 3: Jobs and Wozniak at the Homebrew Computer Club
The Birth of Apple
In 1976, Steve Jobs and Steve Wozniak co-founded Apple Computer, Inc. in the Jobs family garage. The name Apple was decided after Jobs came back All Onee farm commune in Oregon and told Wozniak about the farms apple orchard. They introduced the Apple I, their first computer, and sold it to a local retailer. The success of the Apple I led to the development of the Apple II, which would become one of the first highly successful mass-produced personal computers.
Figure 4: An Apple I computer
Apple Inc. was officially incorporated in 1977, and with Jobs’ vision and Wozniak’s technical expertise, the company started to gain recognition and success. They were pioneers in making technology accessible to the average person, a theme that would define Jobs’ career.
The turning point in Steve Jobs’ life came when he hired John Sculley from PepsiCo to become Apple’s CEO in 1983. This decision ultimately led to Jobs’ removal from the Macintosh division. In 1985, he left Apple, the company he co-founded, under strained circumstances.
Figure 5: An apple Macintosh
Next Computer and Pixar
After leaving Apple, Jobs founded NeXT Computer, a company aimed at creating high-end computers for the education and business markets. Although NeXT Computer did not achieve commercial success, it played a pivotal role in Jobs’ personal growth. The company’s technology and software eventually found its way into the Apple ecosystem, contributing to Apple’s resurgence in the 1990s.
During this period, Jobs also acquired a majority stake in The Graphics Group, which later became Pixar Animation Studios. Under his leadership, Pixar produced a string of blockbuster animated films, including “Toy Story” and “Finding Nemo,” revolutionizing the animation industry and generating substantial wealth for Jobs.
Figure 6: Steve Jobs at Pixar Studios
Return to Apple
In 1996, Apple was on the verge of bankruptcy. The company’s stock price had plummeted, and its future looked bleak. Apple’s board, recognizing the need for a visionary leader, decided to acquire NeXT Computer and bring Steve Jobs back to the company. This was a pivotal moment that set the stage for one of the most remarkable comebacks in business history.
Steve Jobs returned to Apple as its interim CEO in 1997, and he quickly made dramatic changes. He simplified the product lineup, streamlined the company’s operations, and infused Apple with his design sensibilities. Under his leadership, Apple released a series of iconic products, including the iMac, iPod, iPhone, and iPad, which transformed the company into a global technology powerhouse.
One of Steve Jobs’ most significant contributions to Apple and the technology industry at large was his relentless pursuit of innovation and his commitment to design excellence. He was known for his perfectionism and his ability to bring together art and technology. Jobs believed that products should be not only functional but also beautiful and user-friendly.
The iPhone, introduced in 2007, marked a revolution in the smartphone industry. Its sleek design, intuitive interface, and App Store ecosystem changed the way people interacted with technology. The iPhone became a cultural phenomenon, and it propelled Apple to new heights of success.
Legacy and Impact
Steve Jobs’ vision, leadership, and innovation left an indelible mark on the world of technology and business. He passed away on October 5, 2011, but his legacy lives on through the company he co-founded and the products he helped create.
Apple Inc. remains one of the most valuable and influential companies in the world, consistently producing groundbreaking products that shape the future of technology. Under Jobs’ guidance, Apple became the first trillion-dollar company, a testament to his ability to turn a struggling business into a global juggernaut.
Jobs’ approach to business was driven by his passion for innovation and his belief in the power of simplicity and design. His famous product launches, such as the annual iPhone unveilings, became highly anticipated events that showcased his ability to captivate audiences and build excitement around new technology.
Figure 8: Steve Jobs launches Ipad for the first time
Conclusion
The story of Steve Jobs, from rags to riches, is a testament to the power of vision, determination, and innovation. His journey from a college dropout to a co-founder of Apple Inc., his subsequent ousting from the company, and his triumphant return and impact on the technology industry are nothing short of extraordinary. His ability to combine both technology and art was what made him soo successful has he was able to make the computer attractive and appealing to the broader masses of people.
Steve Jobs’ life story inspires individuals worldwide to think differently, dream big, and push the boundaries of what is possible. His legacy continues to influence the way we live, work, and communicate, leaving an indelible mark on the world and reminding us that even from the humblest beginnings, greatness can be achieved with the right combination of passion, talent, and perseverance.
Figure 8: Apple, the small company starting in Jobs garage reached a $1 trillion in value in mid-2018, and it achieved a $2 trillion valuation in August 2020


.JPG)


.jpg)