Let’s begin with a riddle that has baffled more than a few bright minds. Suppose I offer you a choice: either I hand you $1 million right now, or I give you a single penny today that doubles in value every day for 30 days. Which would you take?
Illustration 1: 100 USD, the highest USD note
Most people instinctively jump at the million-dollar offer. A million bucks in hand feels like a dream come true. That’s life-changing money, after all. But if you run the math on that humble penny, something astounding happens. On day five, it’s just 16 cents. On day ten, it’s still under $6. But by day twenty, it explodes past $5,000. And on day thirty? That penny is worth over ten million dollars.
That, in a nutshell, is the sheer power of compounding, the secret sauce behind many of the world’s wealthiest investors. And yet, it remains one of the most misunderstood, underestimated, and underused concepts in personal finance and trading alike. While others chase quick profits and high-risk trades, the smartest players in the game let time do the heavy lifting.
What Is Compound Investing, Really?
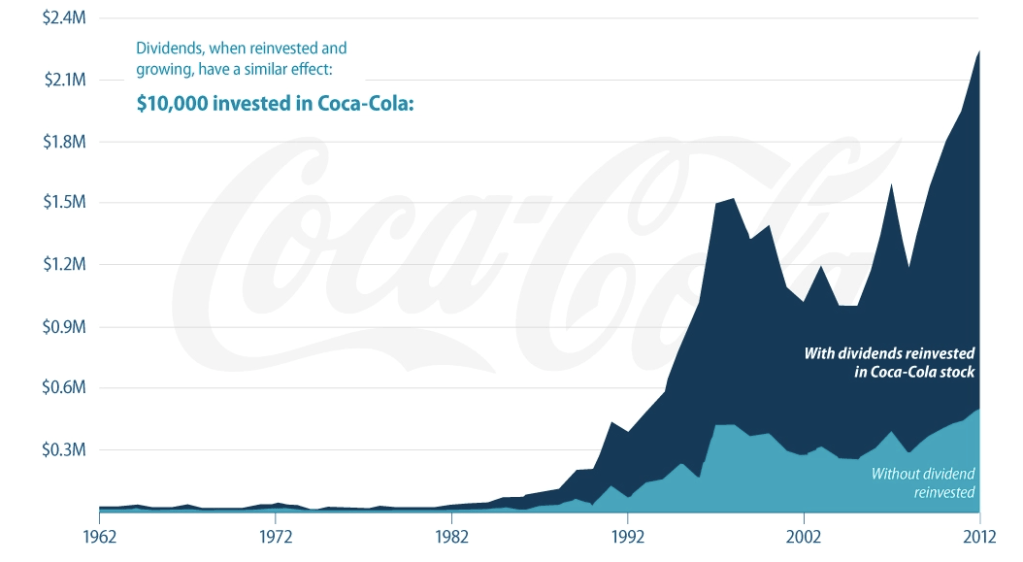
Compound investing is the financial equivalent of planting an apple tree and waiting patiently until you’re sitting in an orchard. At its heart, compounding means that your investments don’t just earn returns, they also earn returns on those returns. It’s a cycle of reinvestment, where growth builds upon growth, snowballing over time into something far greater than you started with.
Imagine putting $1,000 into an investment that earns 10% per year. After one year, you have $1,100. If you leave that full amount invested, the next 10% applies not just to your original $1,000, but to the $1,100 total which gives you $1,210. Then it grows to $1,331, then $1,464, and so on. Eventually, what started as a small seed becomes a forest of wealth.
Illustration 2: You don’t need to do anything, you can be on hammock in Indonesia and just relax if you want to
And the best part? You don’t have to do anything fancy. You don’t need a degree in finance or a crystal ball to time the market. You just need the discipline to start, the patience to wait, and the wisdom to let compounding do its thing.
Why Compound Investing Works Better Than Just About Anything Else
Let’s be blunt: most people want to get rich fast. We are hardwired to crave instant results. That’s why trading apps, meme stocks, and crypto roller coasters are so addictive. They feed the dopamine circuits in our brains. But in the long run, these fast strategies tend to burn more than they build.
Illustration 3: A lot of people such as those at the r/wallstreetbets subreddit focus on getting rich quick.
Compound investing, by contrast, doesn’t try to outsmart the market on a daily basis. It bets on consistency, not cleverness. Over long periods, compounding will often outperform flashy trading simply because it never stops working. Your capital keeps growing while you sleep, while you’re on vacation, while you’re living life. You don’t have to hustle, your money does it for you.
The real beauty of compound investing is that its effect accelerates over time. The longer you leave your investment untouched, the more explosive its growth becomes. This is why starting early is often more powerful than starting big.
The Mathematics of Miracles
The numbers behind compounding are not just impressive, they’re mind-blowing. Let’s take a simple scenario: you invest $10,000 at an 8% annual return, compounded once a year. In 30 years, that $10,000 becomes over $100,000. You didn’t lift a finger, yet your money grew tenfold.
Now, add a monthly contribution of just $300. That same investment explodes to nearly half a million dollars over the same timeframe. The math is straightforward, but the implications are profound. With time and consistency, even modest investments can turn into serious wealth.
Illustration 4: Over time compound interest can lead to serious wealth
There’s even a trick to estimate how long it takes for your investment to double: the Rule of 72. Just divide 72 by your annual return rate. At 8%, your money doubles in 9 years. That’s two doublings in 18 years, four in 36. It sneaks up on you, and suddenly, you’re looking at a portfolio that dwarfs what you ever imagined possible.
Compound Investing vs. Trading: The Showdown
Trading is sexy. It makes for great movies, exciting YouTube channels, and nail-biting nights staring at candlestick charts. But here’s the dirty little secret: most traders lose money. Not just some — most.
Illustration 5: Trading will eat up most of your capital that you could have used to become wealthy
The reasons are many. Transaction fees eat into profits. Emotions lead to poor decisions. Taxes hammer short-term gains. And worst of all, one bad trade can erase dozens of good ones. Trading rewards sharpness, but penalizes mistakes with brutal efficiency.
Compound investing plays a different game entirely. It’s slow, steady, and boring , in the best possible way. It rewards discipline, not luck. It minimizes fees, avoids taxes through long-term holding, and removes emotional triggers. While traders swing for the fences, compound investors jog steadily around the bases. And nine times out of ten, it’s the jogger who wins.
Illustration 6: An illustration showing the power of compound interest
Even in the trading world, the best players understand the power of compounding. They don’t gamble on every tick. They develop strategies that can grow capital sustainably. They think in terms of systems and longevity. In short, they let their skills and their capital compound over time.
Time: The Invisible Multiplier
If compounding is the vehicle, time is the fuel. Nothing supercharges compound investing like giving it time to work. And the earlier you start, the more time you have, the bigger your outcome.
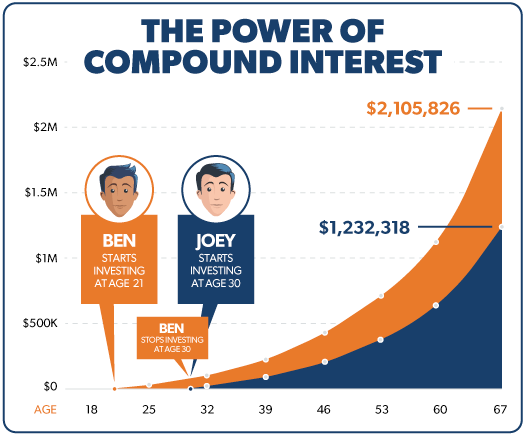
There’s a famous story in finance circles about two hypothetical investors. One starts investing $200 a month at age 22 and stops at 30. The other waits until 30 and invests $200 monthly until retirement at 65. Guess who ends up with more money?
Illustration 7: Time is the fuel that powers it all
Surprisingly, the early starter wins, even though she contributed far less overall. That’s the power of compounding in action. The early years are the most valuable, because they multiply over the longest time. The longer your money compounds, the less you have to contribute later. The system does the heavy lifting.
What Happens If You Start Late?
Now, what if you’re reading this at 35, 40, or even 50 and feeling regret bubble up? Here’s the good news: it’s never too late to harness compounding. Yes, you’ll need to save more aggressively, and you may not have quite as much time. But compound investing still works.
Illustration 8: There is never to late to start compounding which is cause for celebtation
You can boost the effects by increasing contributions, reducing fees, reinvesting dividends, and choosing slightly higher-yielding (but still prudent) investments. The most important thing is to begin, not perfectly, but immediately.
Real Stories, Real Fortunes
Warren Buffett, arguably the greatest investor of all time, built 99% of his wealth after the age of 50. He began investing at age 11 and never stopped. His wealth isn’t due to extraordinary returns, it’s due to extraordinary time. His investing returns have been great, sure — but it’s the decades of compounding that turned great into godlike.
Illustration 9; Legendary Investor Warren Buffet is someone that have built his wealth on compounding
Then there’s Ronald Read, a Vermont janitor who quietly amassed over $8 million through steady investing and compounding. Or Anne Scheiber, a retired IRS agent who left behind $22 million after years of investing modestly in dividend stocks. These weren’t hedge fund managers. They were regular people who simply understood compounding and never gave up on it.
The Investor’s Toolkit: How to Get Started
You don’t need a Wall Street advisor or a six-figure salary to begin. Open a brokerage account or a retirement fund. Automate monthly contributions, even if they’re small. Choose index funds or dividend-paying stocks with a history of stability and growth. Reinvest every dollar you earn. Then walk away. Let it grow.
Illustration 10: You don’t need to be a Wall Street investor to benefit from compound investing, a normal index fund like VOO or SPY will do.
The hardest part is resisting the temptation to tinker. When markets dip, and they will, don’t panic. Compounding doesn’t care about temporary downturns. It thrives over the long haul. The more hands-off you are, the better it works.
There are a few landmines that destroy compounding’s magic. The biggest is pulling out money too early. Every time you interrupt compounding, you reset the process. Another killer is chasing hot trends and high-risk stocks that can wipe out gains. High fees are another silent thief, quietly siphoning away your future wealth. And perhaps worst of all is waiting too long to start.
It’s easy to dismiss compound investing as “too slow” or “too dull.” But those who stick with it know the truth: it’s anything but boring. Watching your money grow, slowly at first, then exponentially, is one of the most thrilling experiences in finance. It feels like cheating — only it’s not.
Compound investing is the rare strategy that doesn’t just build wealth. It builds freedom. It buys you time, security, and peace of mind. It works when you sleep. It grows when you’re busy living. It’s not a sprint — it’s a quiet revolution, unfolding silently in the background.
Conclusion: Be the Turtle, Not the Rabbit
In the fable of the tortoise and the hare, it’s the slow, steady, unshakable turtle who wins the race. Compound investing is your turtle. It doesn’t promise instant riches. It doesn’t thrill with daily highs. But over time, it builds something far more valuable: lasting wealth.
Illustration 11: Be the turtle not the rabbit
In the fable of the tortoise and the hare, it’s the slow, steady, unshakable turtle who wins the race. Compound investing is your turtle. It doesn’t promise instant riches. It doesn’t thrill with daily highs. But over time, it builds something far more valuable: lasting wealth.
So stop chasing hot tips. Ignore the noise. Start investing, early if you can, consistently no matter what, and with patience above all. Let your money work harder than you ever could. Let compounding carry you toward the life you dream of.
Because once you understand compound investing, you’ll realize something extraordinary: you don’t have to get rich quick… when you can get rich for sure.
The Boeing Company is one of the world’s largest aerospace and defense corporations, renowned for its cutting-edge innovations in commercial aviation, space exploration, and military systems. Headquartered in Arlington, Virginia, Boeing plays a pivotal role in global mobility and national defense, supplying aircraft, satellites, and defense systems to customers across more than 150 countries.
Illustration1 : The Boeing logo, a global symbol of aviation excellence and aerospace innovation.
Boeing operates across several major sectors including commercial airplanes, defense, space, and security systems, as well as global services. It is best known for its iconic aircraft such as the 737, 777, and 787 Dreamliner, which have helped connect the world’s cities and economies. Beyond aviation, Boeing leads ambitious projects in space travel, advanced robotics, and autonomous flight technologies.
Unlike many traditional manufacturing companies, Boeing evolved from the pioneering age of aviation and has remained a dominant force throughout the 20th and 21st centuries. Its legacy of innovation, high-performance engineering, and large-scale systems integration makes it a cornerstone of the global aerospace and defense industry.
History
Boeing was founded in 1916 by aviation pioneer William E. Boeing in Seattle, Washington. Originally a small manufacturer of seaplanes, the company played a significant role in both World Wars, supplying military aircraft that proved decisive in combat. Post-World War II, Boeing helped usher in the Jet Age with the launch of the 707, the first successful commercial jetliner.
Illustration 2: Boeing 707, was the first successful commercial jetliner.
Boeing’s commercial success soared with aircraft like the 737, 747, and 777, revolutionizing long-distance air travel. The 747, in particular, became a global icon and the world’s first wide-body “jumbo jet,” transforming air travel in the 1970s.
In 1997, Boeing merged with McDonnell Douglas, strengthening its position in the defense sector. The company also expanded into space systems, becoming a key contractor for NASA, including work on the International Space Station, Space Launch System, and Starliner crew capsule.
Despite facing challenges such as the 737 MAX crisis, global supply chain issues, and geopolitical headwinds, Boeing continues to be a vital force in aerospace innovation and global defense capabilities.
Operations and Production
Portfolio
Boeing is one of the world’s leading aerospace companies, with core operations centered around the design, manufacture, and support of commercial airplanes, defense systems, satellites, and space exploration technologies.
Its flagship commercial aircraft include the 737, 747, 767, 777, and 787 Dreamliner families. With operations in over 65 countries and customers in more than 150, Boeing is one of the largest exporters in the United States.
Its operations are divided into three primary business units:
Illustration 3: A Boeing commercial plane landing.
Boeing Commercial Airplanes (BCA), which designs, assembles, and delivers aircraft to airlines and leasing companies. Boeing’s commercial aircraft families include 737 (The best-selling jetliner in history, primarily used for short- to medium-haul routes) and 787 Dreamliner (A long-haul, fuel-efficient wide-body aircraft made with composite materials).
Furthermore, it includes 777 and 777x ( Known for long-range and high-capacity, with the 777X featuring folding wingtips and the world’s most powerful jet engines), and 767 and 747-8 (used for both passenger and cargo operations, with the 747 being the iconic “Queen of the Skies).
Illustration 4: A Boeing Spy plane
The second division of Boeing is Boeing Defense, Space & Security (BDS) which delivers products and services to government customers worldwide. This includes: Combat aircraft such as the F/A-18 Super Hornet and F-15EX Eagle II. Furthermore it also includes Rotary-wing platforms like the AH-64 Apache and CH-47 Chinook helicopters.
Missile defense systems, satellites, and space launch systems including the Space Launch System (SLS), the most powerful rocket NASA has ever built, is also part of the BDS division of Boeing.
The third division is Boeing Global Services (BGS) which offers logistics, maintenance, training, parts, and digital aviation services. BGS supports both commercial and defense customers with end-to-end lifecycle services
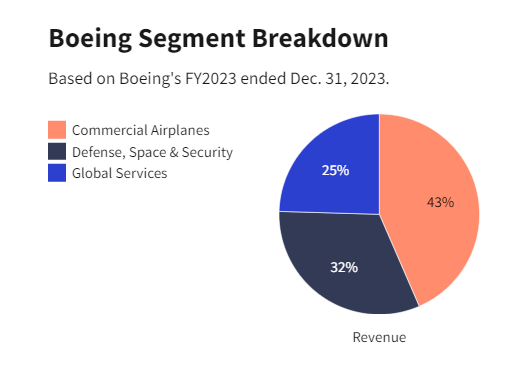
Illustration 5: Boeing revenue by segment
As can be seen from illustration 4, the largest segment for Boeing is commercial Airplanes at 43%. However, Defense, Space & Security also makes up a very big segment at 32% and Global Services at 25 %.
Boeing’s global manufacturing network includes major facilities in the U.S. (notably Everett and Renton, Washington; Charleston, South Carolina; and St. Louis, Missouri), along with significant operations in Australia, the U.K., Canada, and the Middle East.
Technology and Space
Boeing plays a key role in space exploration and defense innovation. Through its work with NASA, Boeing helped develop the International Space Station (ISS) and is now working on the Starliner spacecraft, designed to transport astronauts to low Earth orbit.
In defense, Boeing is investing in autonomous systems such as the MQ-25 Stingray (an unmanned aerial refueling aircraft), loyal wingman drones, and space-based missile defense technologies. Boeing is also a key player in hypersonic weapons development and satellite constellations for secure communications and Earth observation
In the AI and digital space, Boeing uses advanced analytics, machine learning, and digital twins to optimize manufacturing, maintenance, and flight operations. he company’s “AnalytX” suite supports real-time fleet health monitoring, and its digital solutions are integrated into flight operations globally.
Illustration 6: Loyal Wingman, an AI-enabled drone developed in Australia, designed to operate alongside manned fighter jets.
Key Competitors
Boeing competes across various aerospace and defense sectors. Its competitors differ depending on whether the focus is on commercial aviation, defense contracts, or space exploration.
1. Commercial Aviation
Airbus SE is Boeing’s primary global competitor in commercial aircraft. Airbus’s A220, A320neo, and A350 families compete head-to-head with Boeing’s 737 MAX, 787, and 777 series.
COMAC is backed by the Chinese government, COMAC aims to reduce reliance on Western aircraft through its C919 and ARJ21 models.
Embraer is a leading manufacturer of regional jets, Embraer was once part of a failed merger with Boeing but remains a strong player in the 70–150 seat market.
2. Defense and Military Systems
Lockheed Martin, dominates in fighter aircraft and space systems with platforms like the F-35 and Orion.
Northrop Grumman is a competitor in autonomous aircraft, strategic bombers (B-21 Raider), and satellite systems.
Raytheon Technologies, provides engines (via Pratt & Whitney), avionics, and missile systems used in both commercial and military platforms.
3. Space and Emerging Tecg
SpaceX, Elon Musk’s company is a disruptive force in spaceflight, reusable rockets, and low Earth orbit (LEO) satellite networks (Starlink).
Blue Origin is competing with Boeing for lunar landers and suborbital space tourism.
Palantir, Anduril is tech firms, entering defense with AI-powered battlefield intelligence and surveillance systems.
Competitive Advantage
Boeing’s competitive advantage is rooted in its scale, technical expertise, and diverse operations across commercial aviation, defense, and space.
As one of the oldest and most recognized names in aerospace, Boeing benefits from a strong brand reputation built on decades of delivering reliable, high-performance aircraft and systems. This reputation fosters long-term trust and loyalty among airlines, governments, and space agencies worldwide.
Illustration 7: A Boeing Aircraft flying over the Alps
The company’s vertically integrated operations and vast global supply chain give it the ability to manufacture complex systems at scale, while also adapting to local markets and geopolitical shifts. Boeing’s Global Services division adds further value by offering lifecycle support, digital solutions, and predictive maintenance, deepening customer relationships beyond the point of sale.
Boeing’s broad product portfolio, from narrow-body jets and wide-body aircraft to fighter jets, satellites, and launch vehicles, allows it to spread risk and capture opportunities in multiple markets. During commercial downturns, its defense and space segments provide financial stability and continuity.
Innovation is another core strength. Boeing continuously invests in advanced manufacturing, autonomous systems, artificial intelligence, and sustainable technologies. Programs like the ecoDemonstrator test platform and partnerships in urban air mobility demonstrate its commitment to shaping the future of flight.
Illustration 8: A Boeing 777
Combined with its global presence and government partnerships, Boeing’s ability to integrate technology, scale, and service gives it a clear edge in a highly competitive industry.
Future Outlook
Boeing is entering a new growth phase as the aviation industry rebounds and global demand for commercial aircraft returns. The company is ramping up production of its 737 MAX and 787 models, while its defense and space divisions continue to secure major contracts, especially in the U.S. and Asia-Pacific.
Sustainability is at the core of Boeing’s future strategy, with investments in sustainable aviation fuels, electric and hydrogen propulsion, and next-generation aircraft. Its space ventures, including the Starliner and Space Launch System, position Boeing to play a major role in future space exploration. With a strong order backlog and focus on innovation, Boeing is well placed to lead the aerospace industry into the next era.
Stock Analysis
In this section we will analyze Toyota’s stock to see if it is a good stock to buy or not. Our philosophy is value investing meaning that we try to find good quality companies that are undervalued. However, we will give a holistic overview so all kind of investors with different philosophies can judge the stock for themselves.
Revenue and Profits
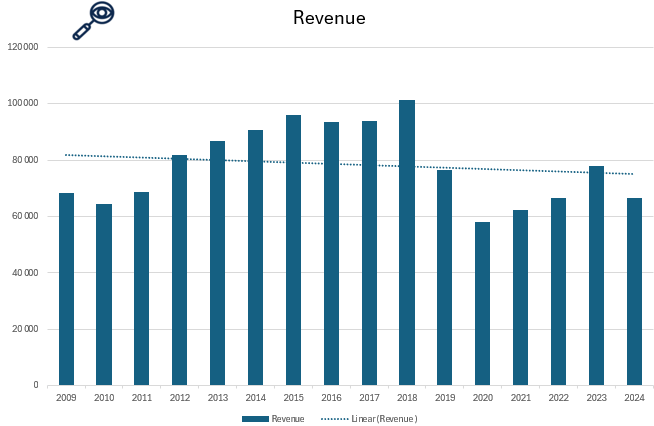
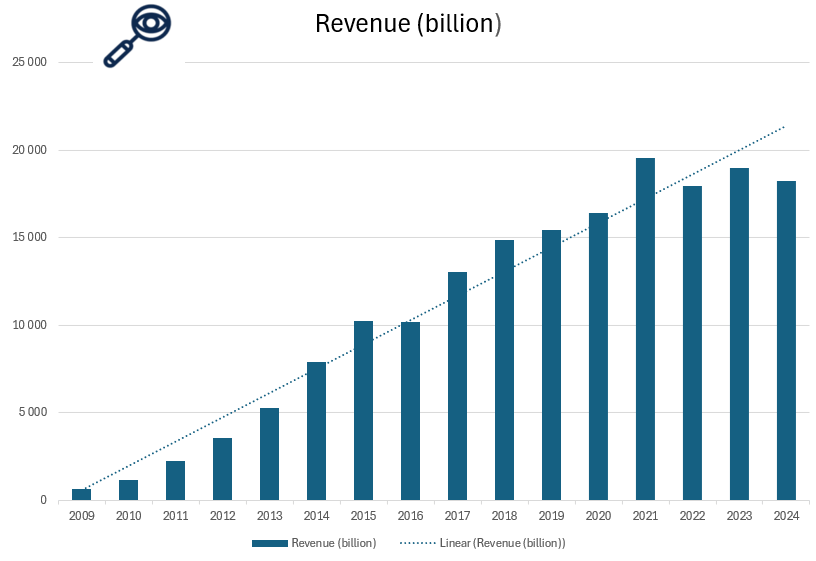
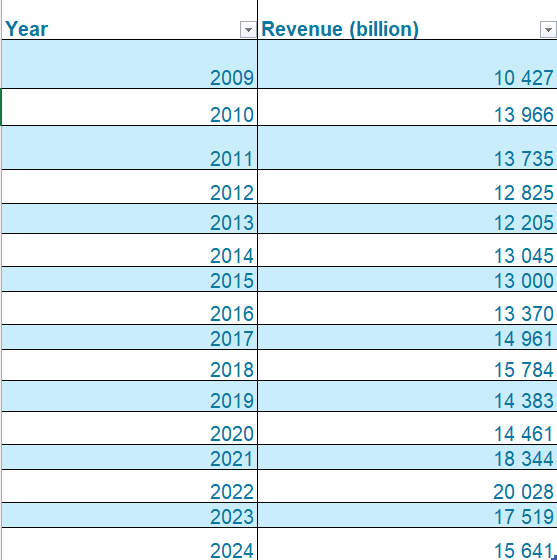
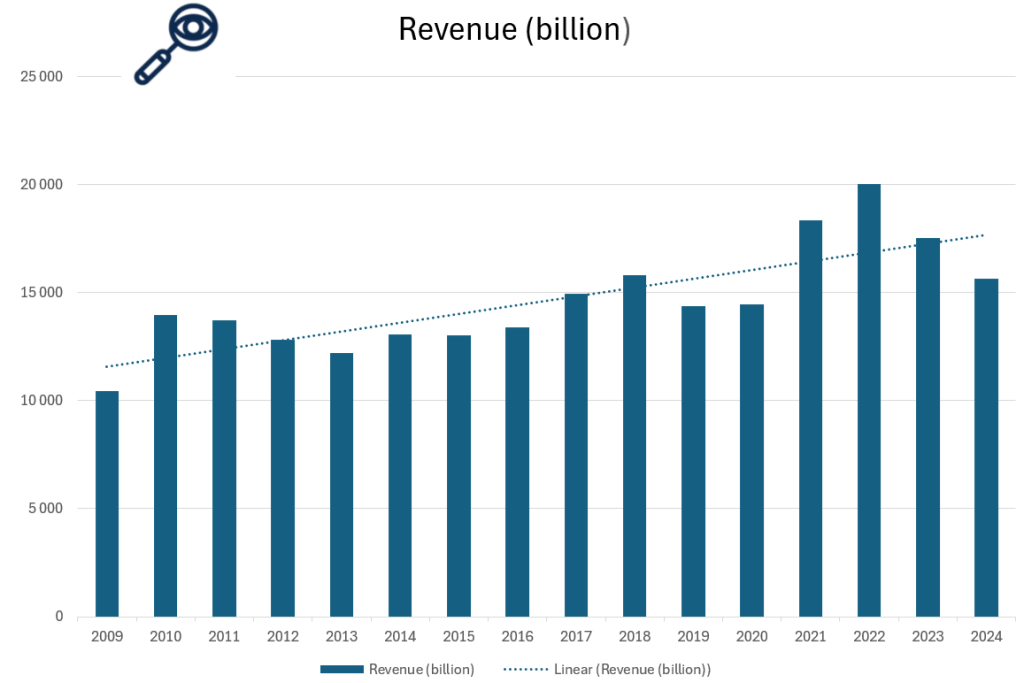
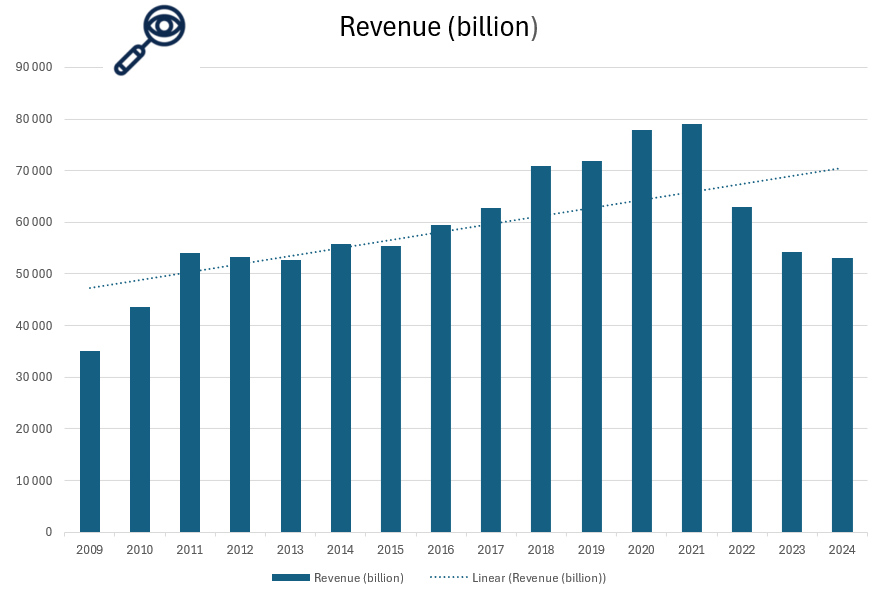
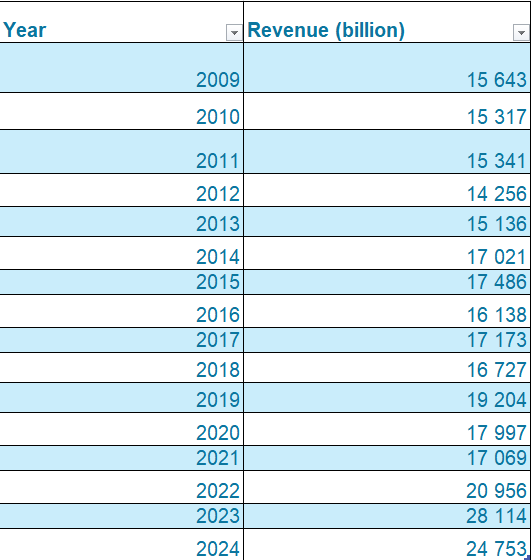
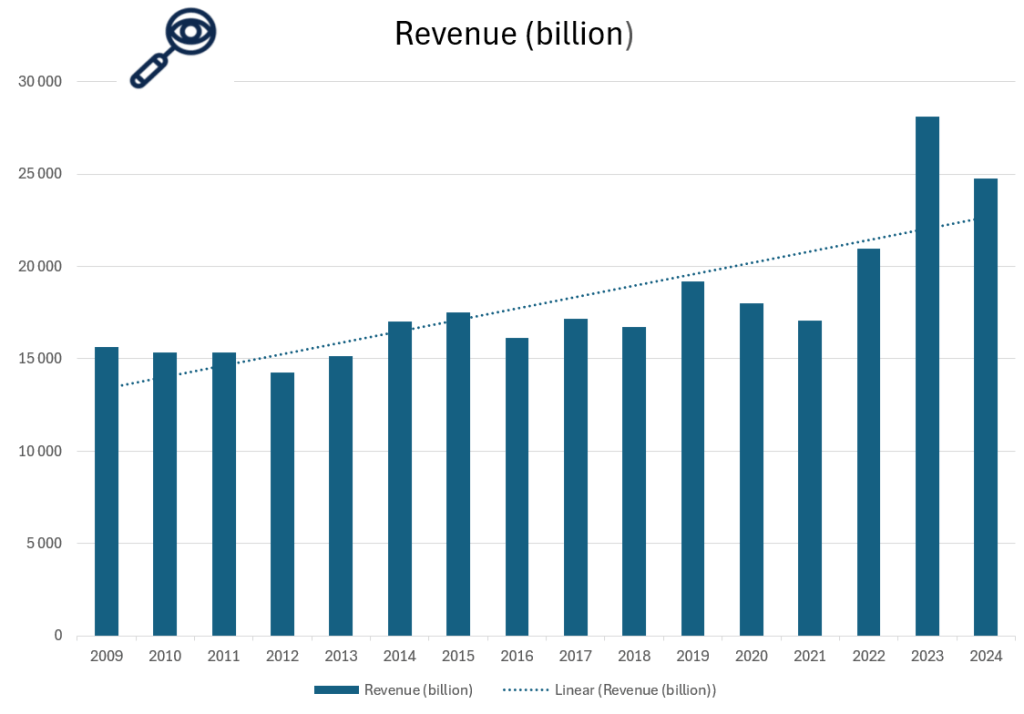
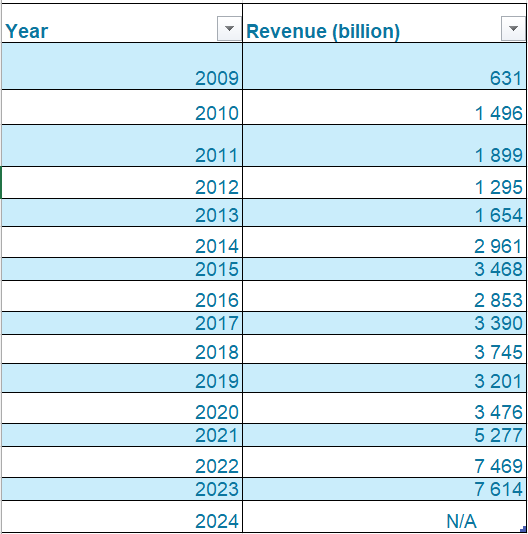
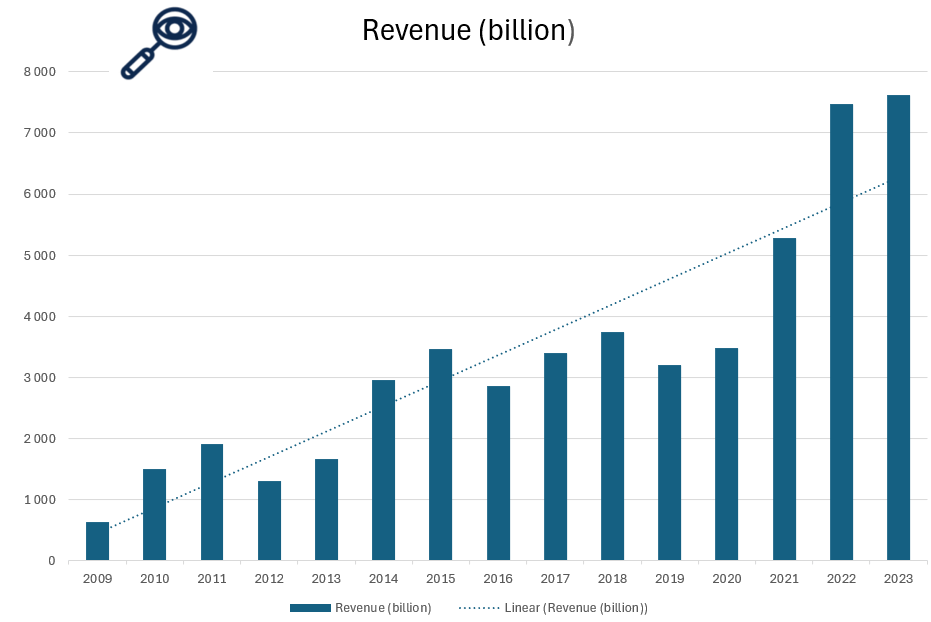
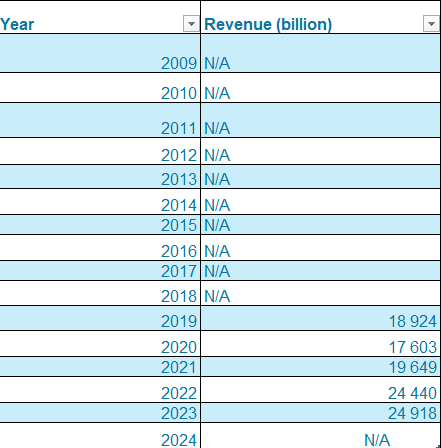
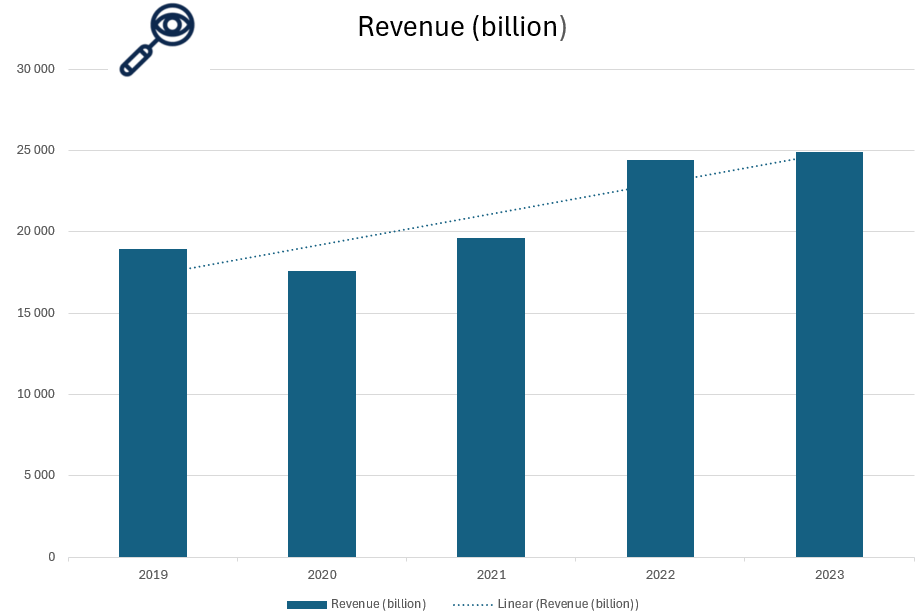
Illustration 9 and 10: Revenue of Boeing from 2009 to 2024
As shown in Illustrations 9 and 10, Boeing’s revenue trajectory has had sharp fluctuations rather than steady growth, with a particularly severe decline between 2018 and 2020. After peaking at around USD 101 billion in 2018, revenues plunged to approximately USD 58 billion by 2020, a staggering drop of over 40% in just two years. This steep decline, triggered by the grounding of the 737 MAX and compounded by the COVID-19 pandemic’s impact on global air travel, raising red flags for investors about Boeing’s operational resilience and crisis management.
While Boeing has made progress in recovering since then, revenues have not yet returned to pre-2018 levels as of 2024. The pace of recovery has been gradual, reflecting ongoing efforts to stabilize production, resolve supply chain issues, and rebuild customer confidence. Boeing’s focus on both commercial and defense segments provides some diversification, but its performance remains sensitive to the global aerospace market and regulatory developments.
Overall, Boeing’s financial performance over the past several years reflects a company navigating a complex recovery phase. The revenue volatility underscores the challenges faced during a turbulent period, but also highlights the potential for future growth as commercial aviation rebounds and new aircraft programs come online. For investors, this mixed picture calls for careful monitoring rather than a clear red or green flag.
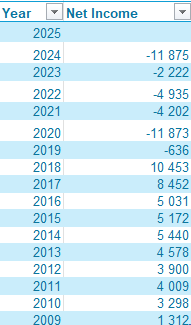
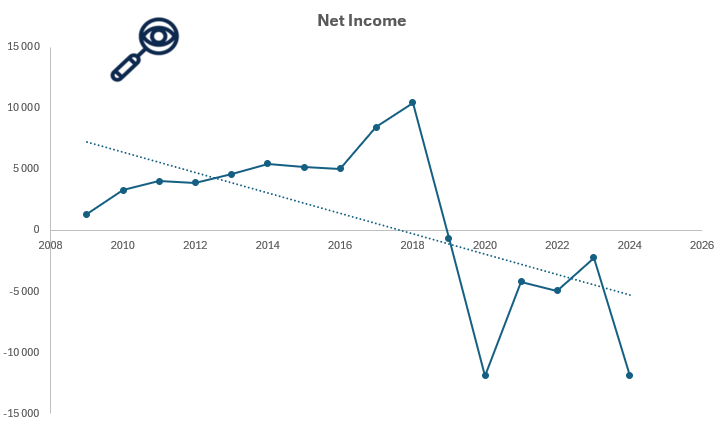
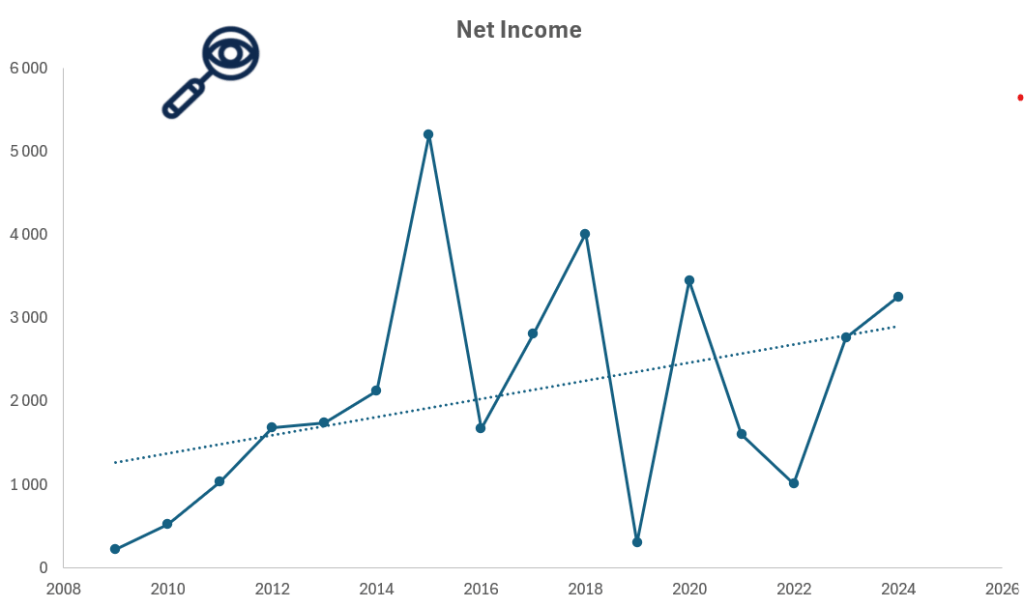
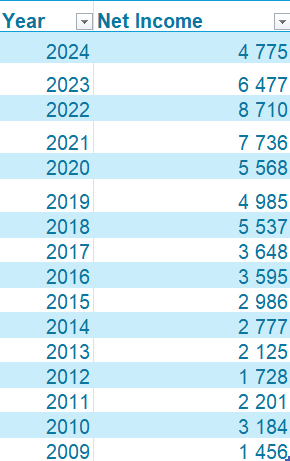
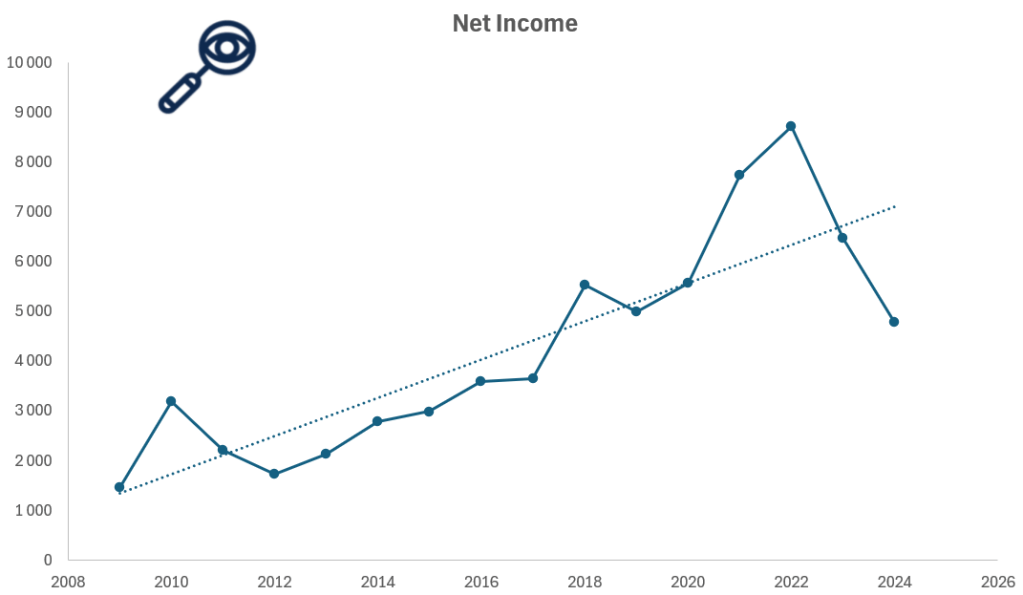
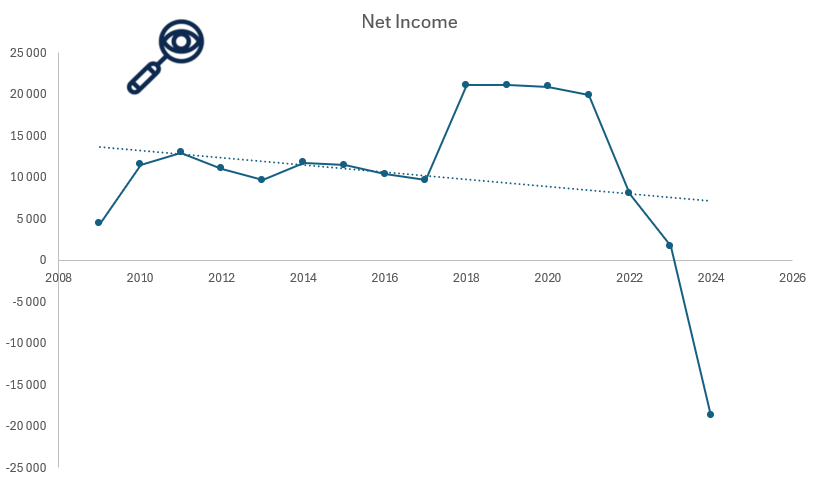
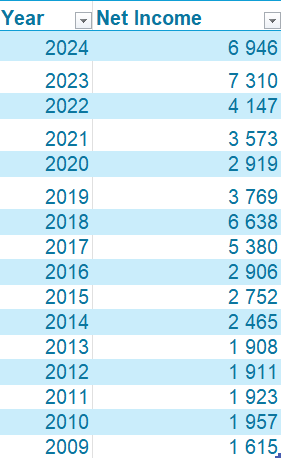
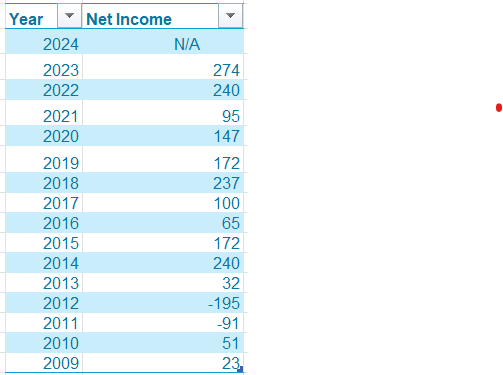
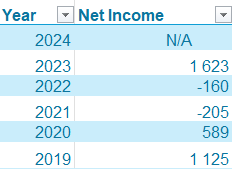
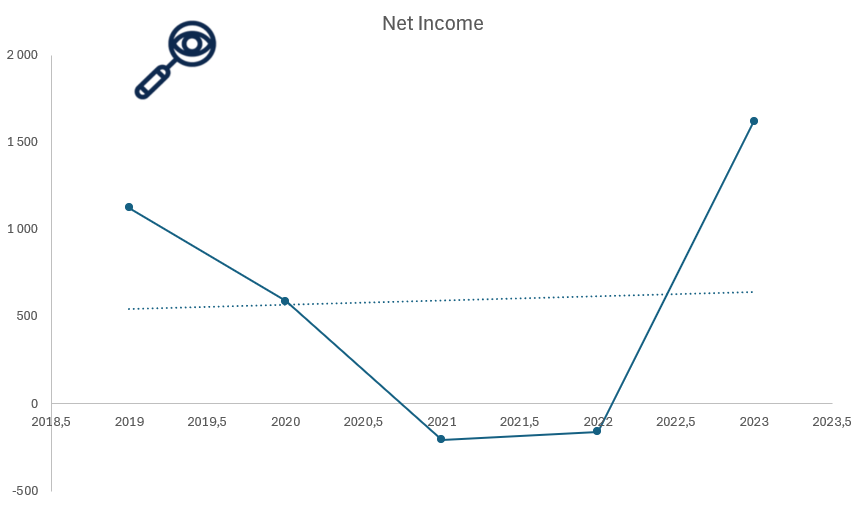
Illustration 11 and 12: Net Income of Boeing from 2009 to 2024
Net income is a crucial metric to evaluate when determining whether a company is a worthwhile investment. It represents a company’s net profit or loss after accounting for all revenues, income items, and expenses, calculated as Net Income = Revenue – Expenses.
As seen in Illustrations 10 and 11, Boeing’s net income has shown significant volatility, with a sharp decline into negative territory from 2018 to 2020. This drop, driven by the 737 MAX crisis and the pandemic’s impact on air travel, marks a clear red flag, as profits fell even more steeply than revenues.
Although Boeing has made efforts to recover, net income remains inconsistent, reflecting ongoing challenges in production, regulation, and market demand. Unlike companies with steady profit growth, Boeing’s recent earnings instability signals elevated risk for investors focused on financial reliability.
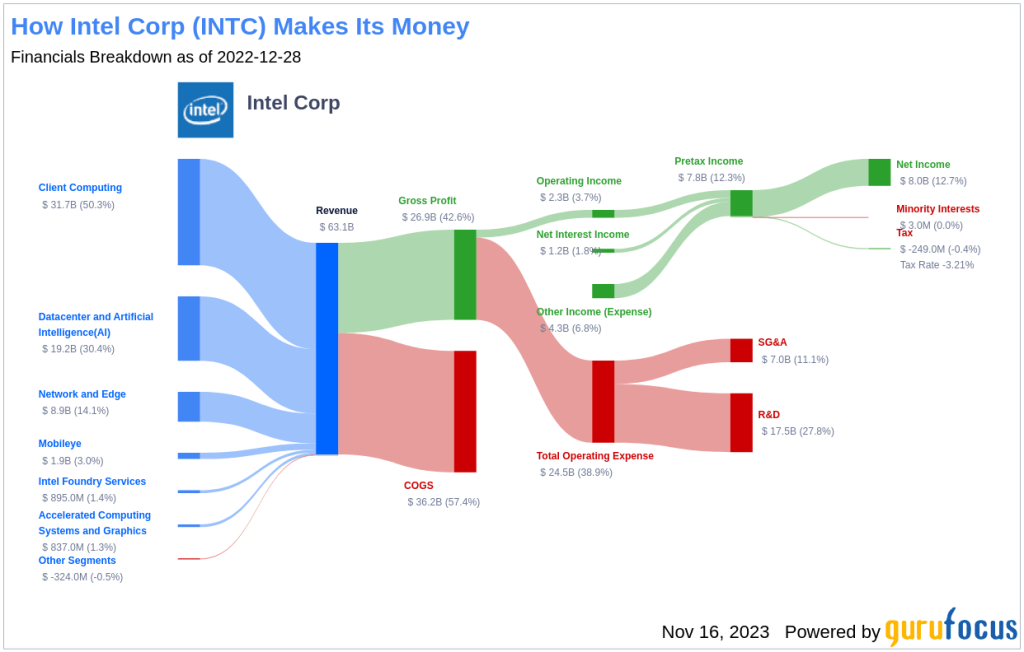
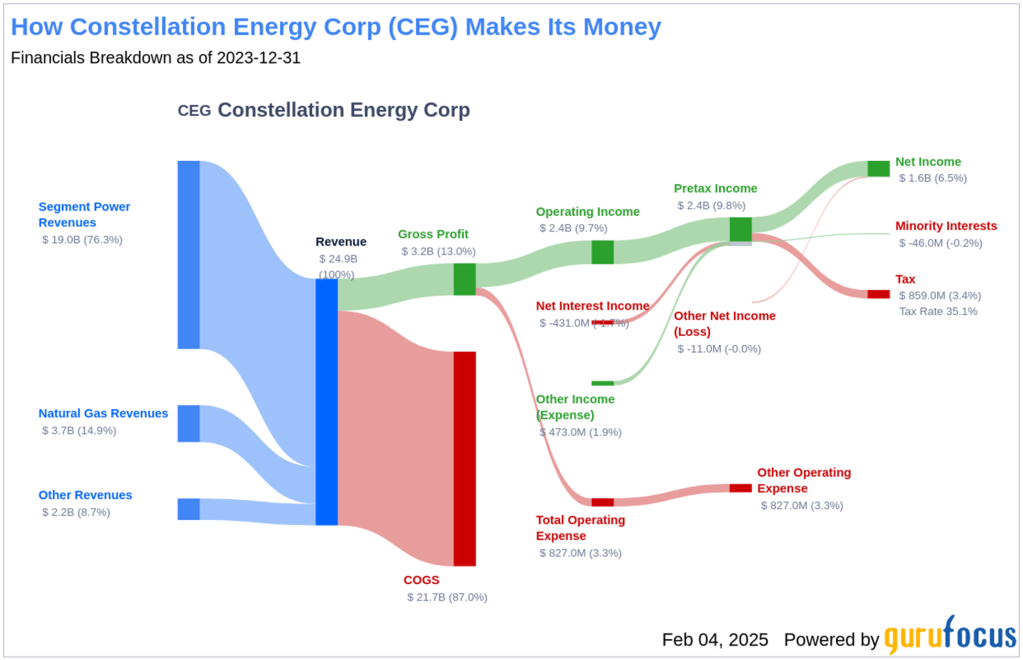
Revenue Breakdown
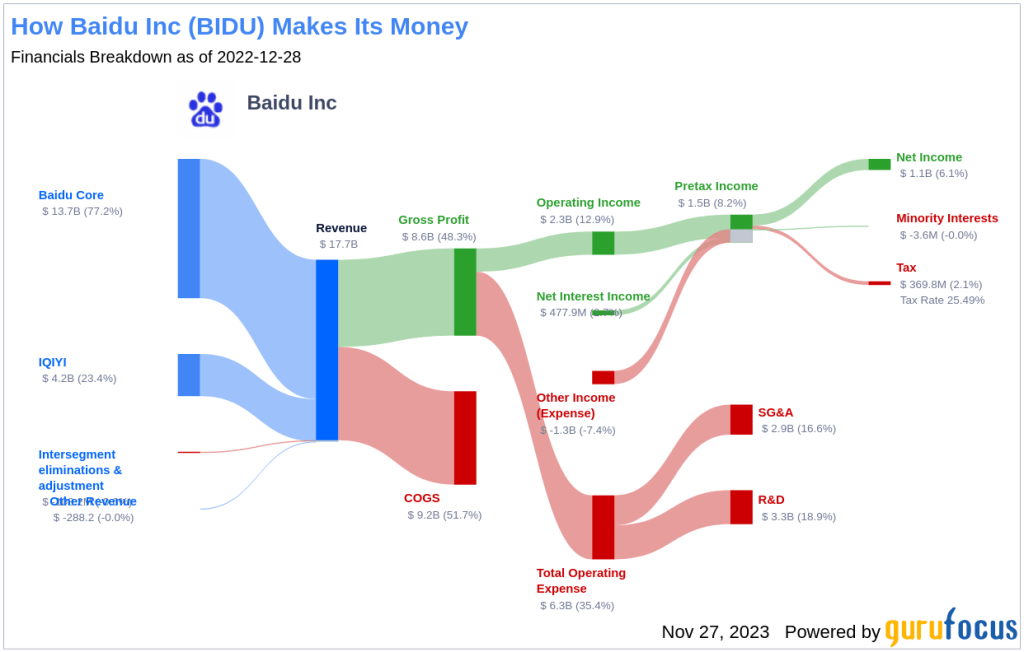
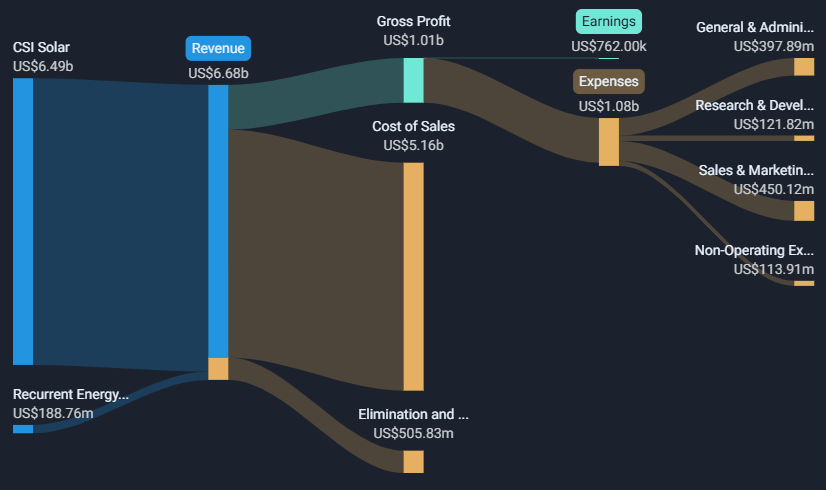
Illustration 13: Revenue breakdown of Boeing Co,
As shown in Illustration 13, Boeing’s core Commercial Airplanes segment remains its largest revenue contributor, typically accounting for around 40% of total revenue. This includes sales of aircraft such as the 737, 787, and 777 models to global airline customers and leasing firms. While historically a strong growth engine, this segment has experienced significant disruption since 2019 due to the 737 MAX grounding, COVID-19, and ongoing supply chain issues, resulting in elevated costs and production delays.
The Defense, Space & Security division, contributing around 35% of revenue, provides more consistent performance through multi-year government contracts for military aircraft, satellites, and surveillance systems. Boeing Global Services, making up roughly 26% of revenue, generates recurring income from maintenance, spare parts, pilot training, and digital analytics—supporting airline customers through fleet lifecycle services.
Boeing’s main costs that eats up most of it’s revenue is cost of goods sold (COGS) which remains very high, typically representing around 94.7% of revenue, reflecting the capital-intensive nature of aircraft production and frequent cost overruns related to rework and supply constraints. SG&A expenses covers global operations, customer support, and corporate functions while R&D expenses focuses on fuel efficiency, autonomous systems, digital engineering, and sustainable aviation, though these initiatives are still early in commercial impact. Emerging technologies such as space-based systems, electric propulsion, and advanced air mobility are strategically important but currently represent a small share of revenue. These areas are gradually expanding through joint ventures and government partnerships.
Overall, Boeing’s revenue structure reflects both high operating complexity and long-term diversification. While its defense and services businesses offer some financial stability, elevated costs and pressures in the commercial segment pose near-term challenges. The company’s ongoing investment in innovation underscores its long-term vision, but achieving margin recovery will depend on execution, supply chain normalization, and restoring commercial delivery volumes.
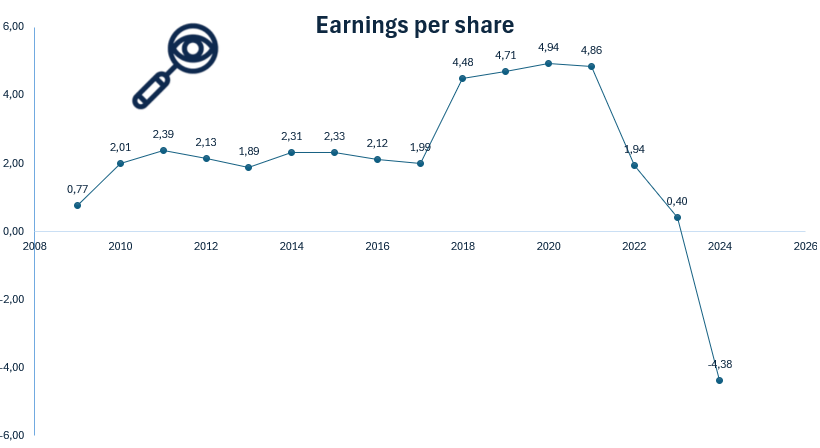
Earnings per Share
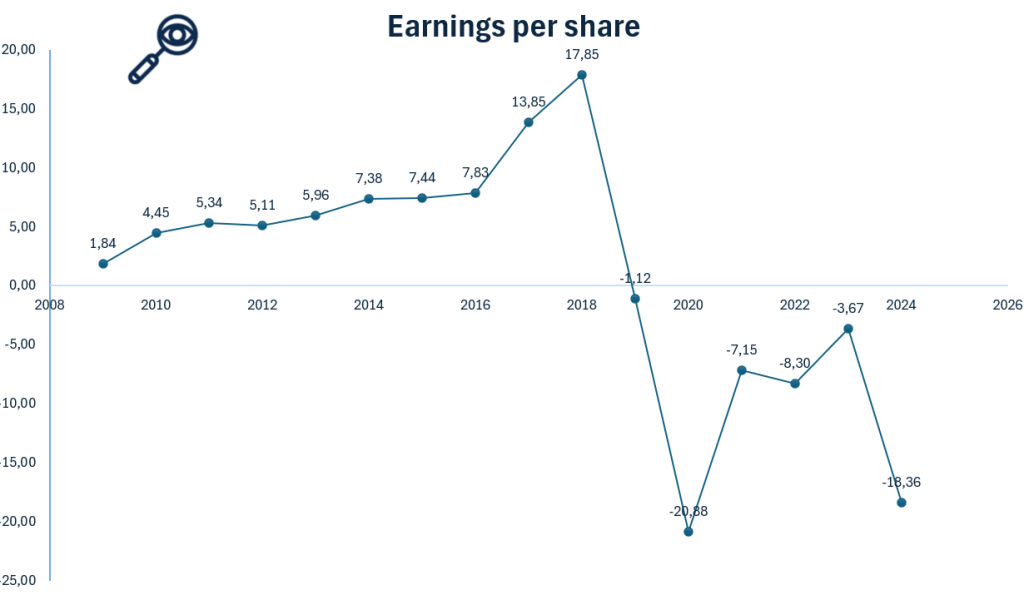
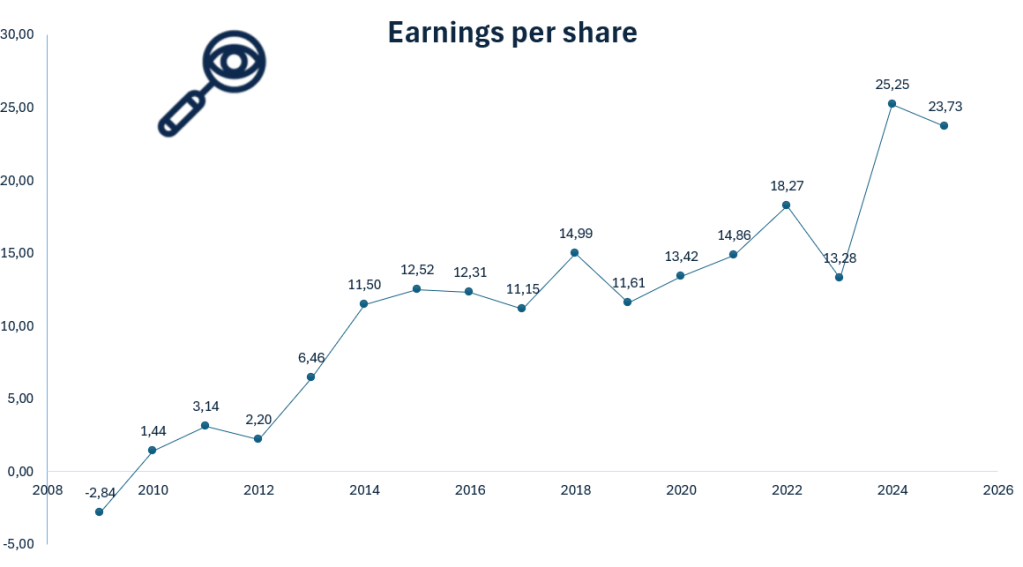
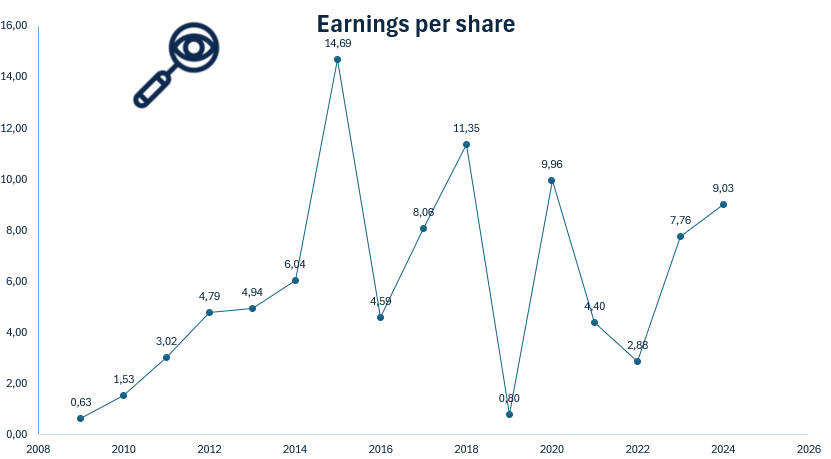
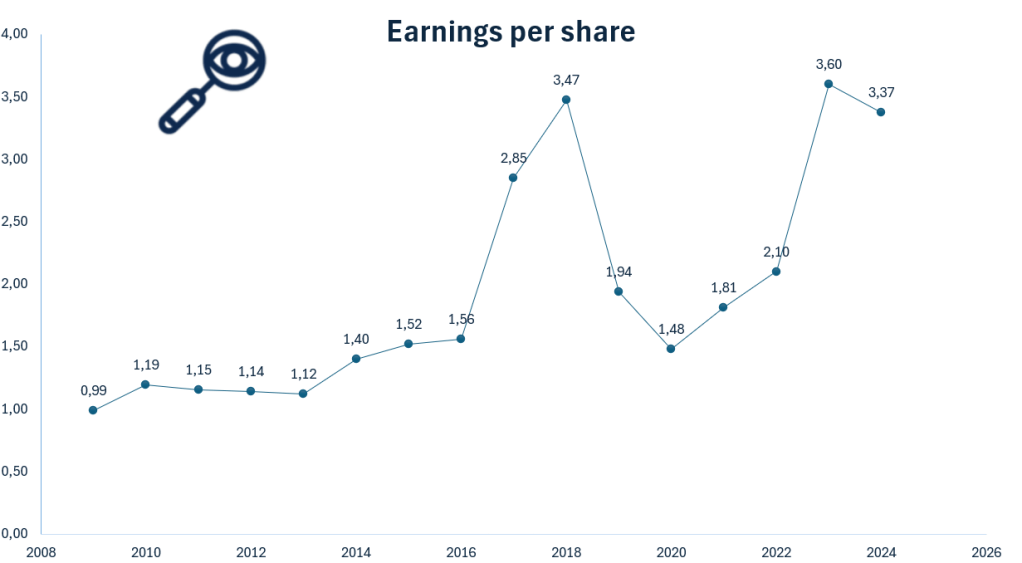
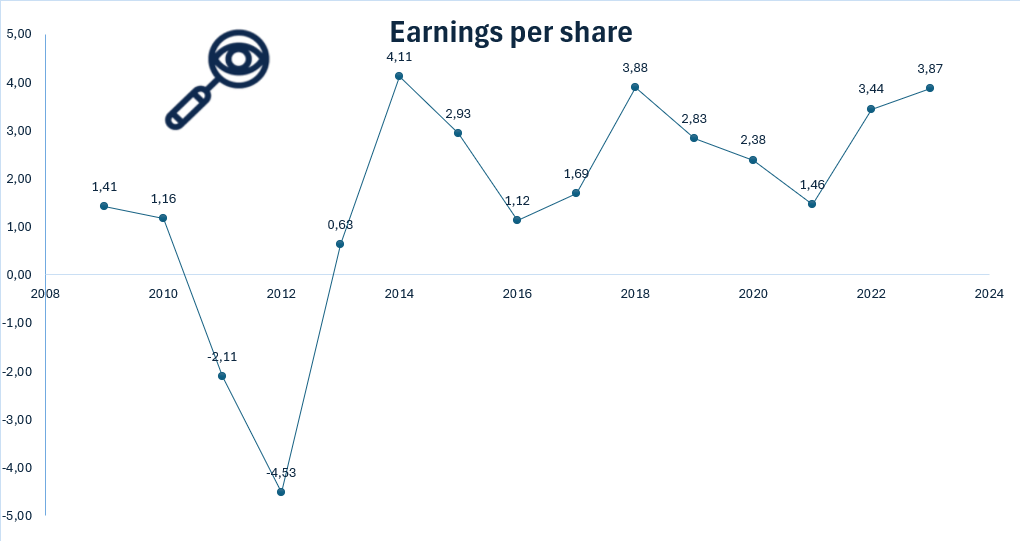
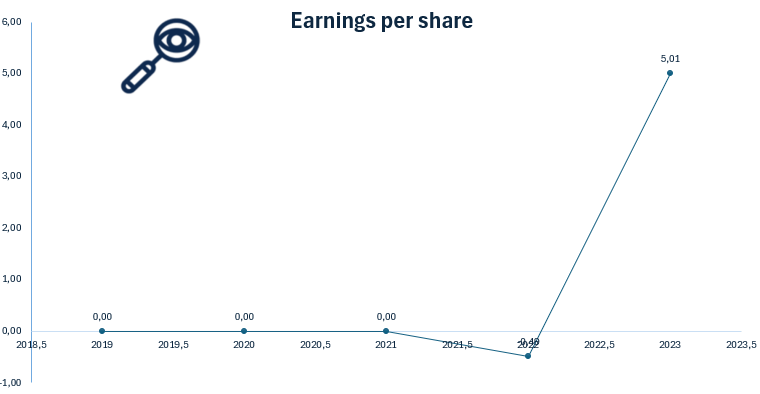
Illustration 14: Earnings per share for Boeing from 2009 to 2024
Earnings Per Share (EPS) is a key financial metric that measures a company’s profitability on a per-share basis. It indicates how much profit a company generates for each outstanding share of its stock, and is used to assess a company’s financial health, profitability, and potential for growth. In other words this metric can tell us how profitable the business is.
The EPS figure itself isn’t the primary focus for value investors, it can be 0.2 or 10, but what truly matters is the company’s ability to generate consistent earnings growth. A steadily increasing EPS over time signals strong financial health, profitability, and long-term value creation.
Boeing’s earnings per share from 2009 to 2025 shows a sharp decline from 17.85 in 2018 to -20.88 in 2020, marking a significant red flag. This drop was driven by the 737 MAX grounding and the pandemic’s impact on global aviation. While EPS has recovered somewhat in recent years, it remains below pre-crisis levels, reflecting continued cost pressures, supply chain issues, and production delays. The volatility in earnings highlights Boeing’s financial vulnerability during industry shocks and signals ongoing risk. For investors, this uneven trend raises concerns about near-term stability despite the company’s long-term strategic efforts. Furthermore, it had another significant drop from 2023 to 2024. These developments should be closely monitored by potential investors and are clear red flags.
Assets and Liabilities
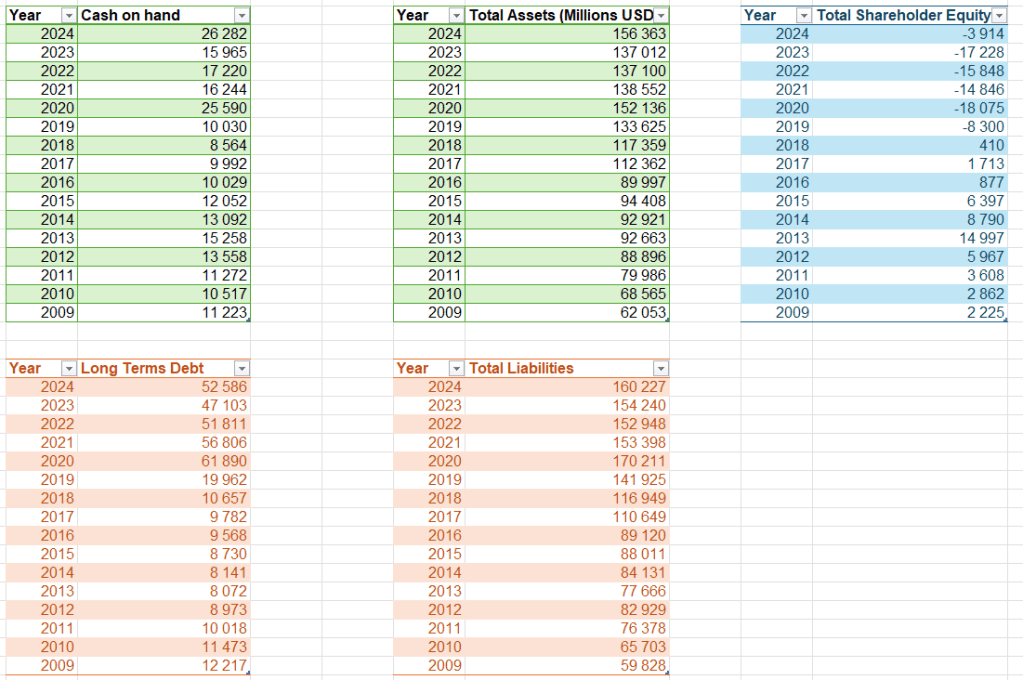
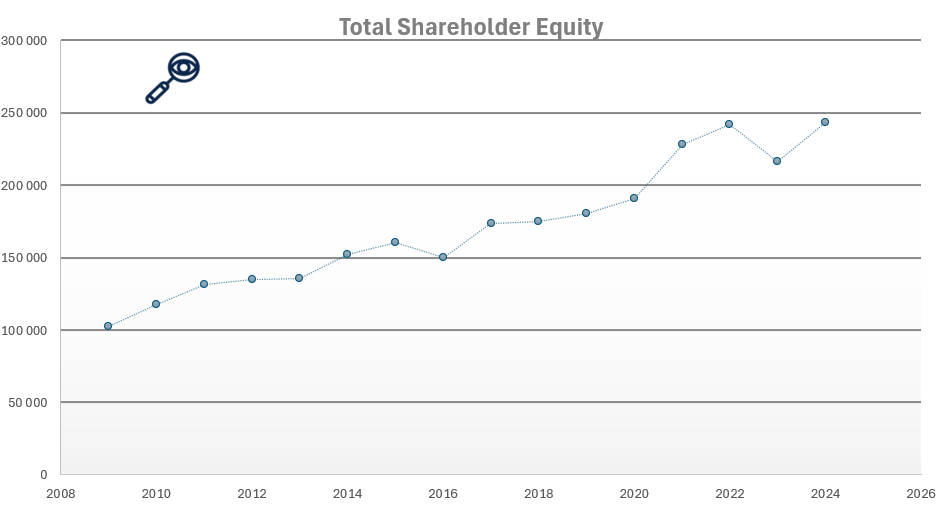
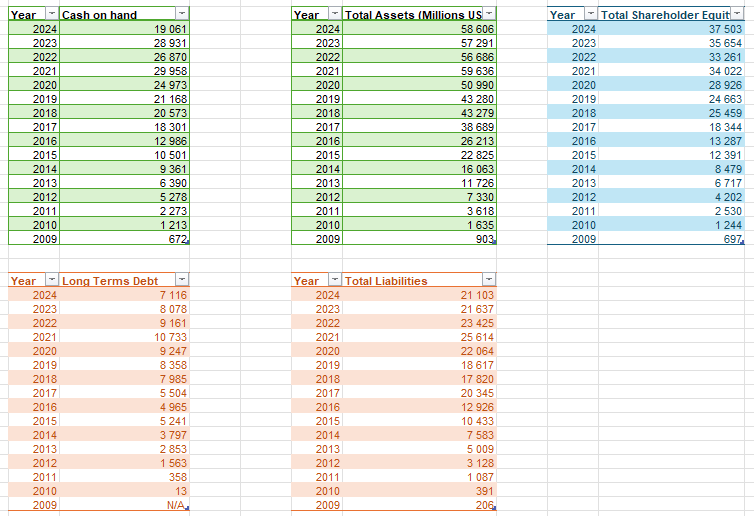
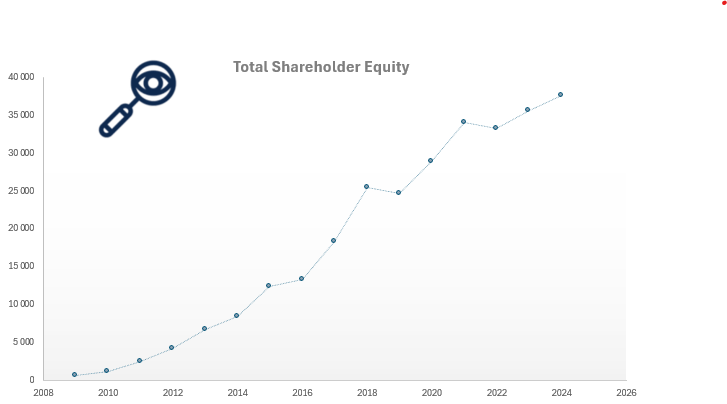
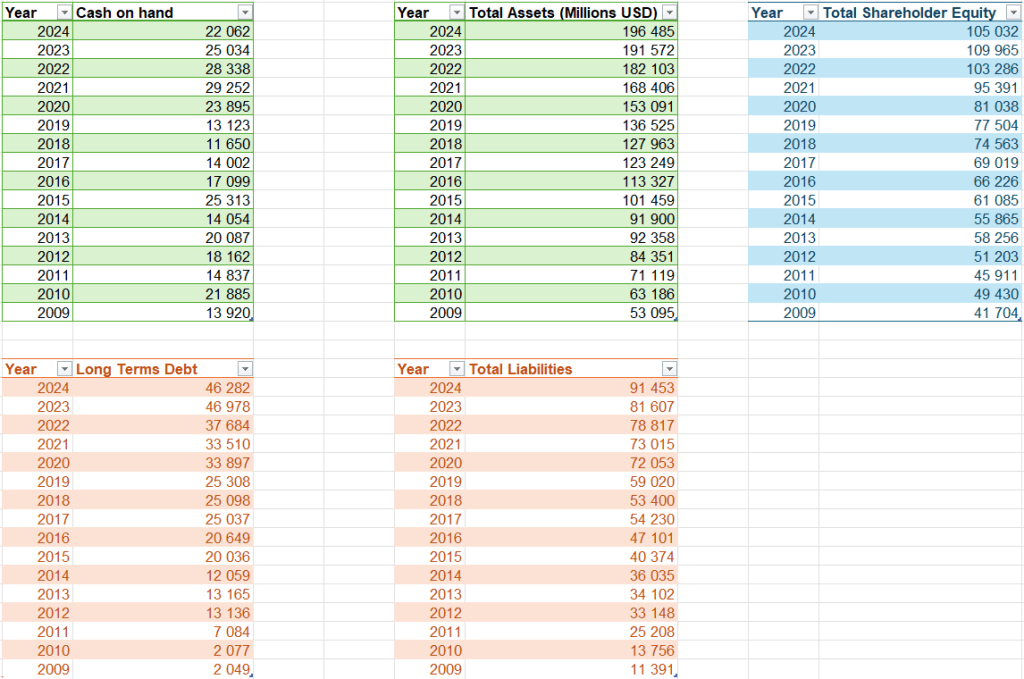
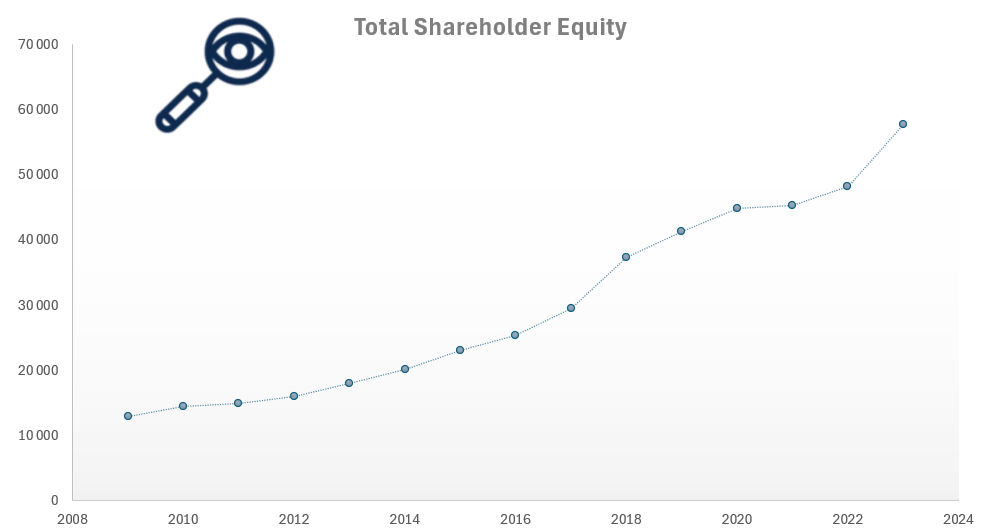
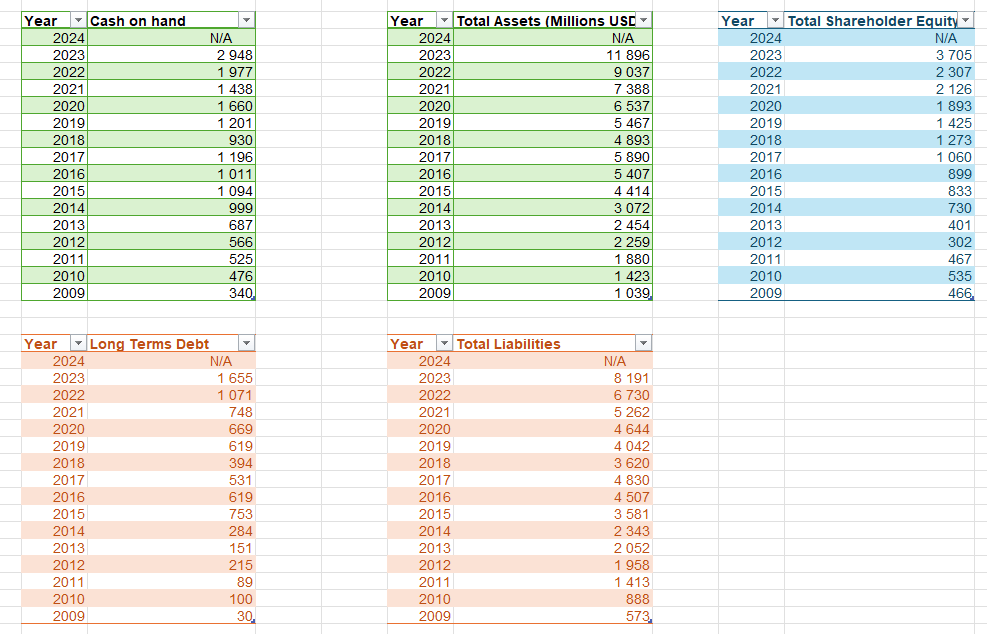
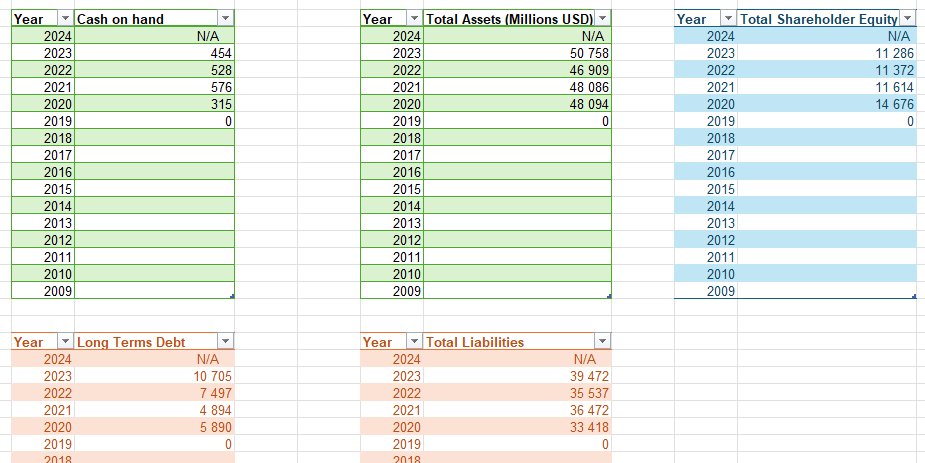
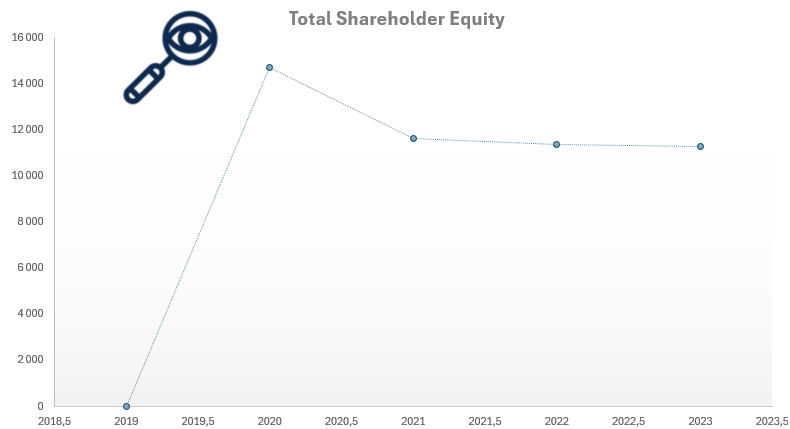
Illustration 15 and 16: Assets and Liabilities for Boeing from 2009 to 2024
When evaluating a company as a potential investment, understanding its assets and liabilities is crucial. If a local business owner offered to sell their shop to you, one of the first questions. after determining its profitability, would be about its equity and assets. The same principle applies when assessing publicly traded companies like Boeing.
As shown in Illustrations 14 and 15, Boeing’s total assets reached approximately $156 billion in 2024, a figure that reflects the scale of its global operations. However, unlike the steady asset growth seen in some peers, Boeing’s asset base has fluctuated over the past decade due to write-downs, delivery delays, and program-related adjustments. While recent investments in next-generation aircraft and digital systems signal a forward-looking strategy, overall asset growth has been modest and uneven.
At the same time, Boeing’s total liabilities have increased substantially, rising to over $160 billion in 2024. Much of this is tied to debt issued during the pandemic to maintain liquidity and stabilize operations. While some leverage is expected in capital-intensive industries, Boeing’s high debt load combined with continued cash flow pressures raises concerns and big red flags about long-term financial flexibility and resilience. Investors should closely monitor Boeing’s ability to reduce debt and restore balance sheet strength in the coming years.
The critical issue for investors is whether Boeing can return to sustained profitability while managing its obligations. With thin margins and ongoing production costs, the company faces the challenge of generating sufficient free cash flow to reduce its liabilities without sacrificing investment in innovation and quality control. Failure to improve operating efficiency or deliver aircraft at scale could intensify financial strain.
Boeing’s cash on hand in 2024 remains relatively low compared to its long-term debt, which presents a red flag for liquidity. This imbalance could make it more difficult to weather unexpected disruptions or fund strategic initiatives without additional borrowing or asset sales. Investors should keep a close watch on Boeing’s cash generation and working capital management to assess its ability to support operations and repay obligations in the near term.
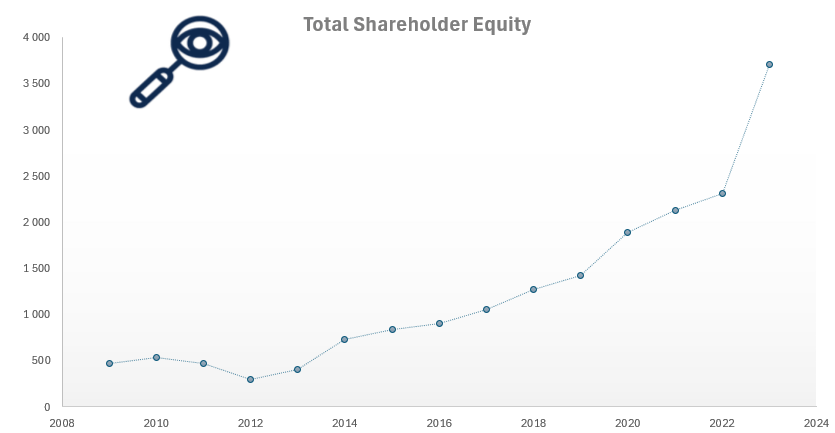
As seen in Illustration 15, Boeing’s total shareholder equity has turned negative in recent years, meaning its liabilities exceed its assets. This trend is a serious concern, as it indicates erosion of the company’s financial foundation and limited cushion against further losses. Negative equity can restrict financial flexibility and undermine investor confidence, especially if cash flow does not improve. While Boeing retains strong long-term potential in aerospace and defense, rebuilding equity will be essential to restoring investor trust and ensuring long-term financial stability.
Debt to Equity Ratio
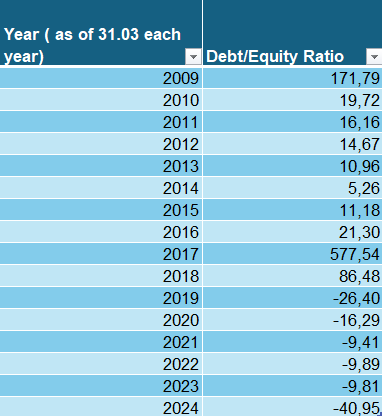
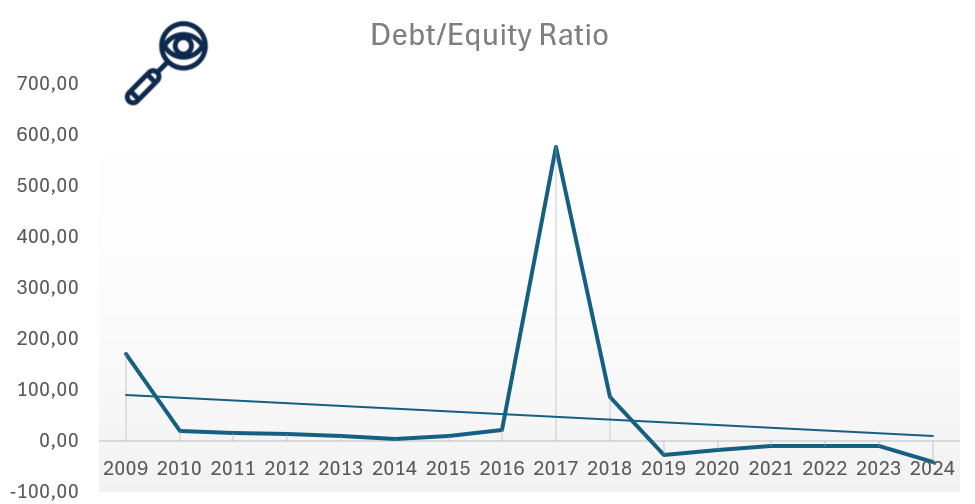
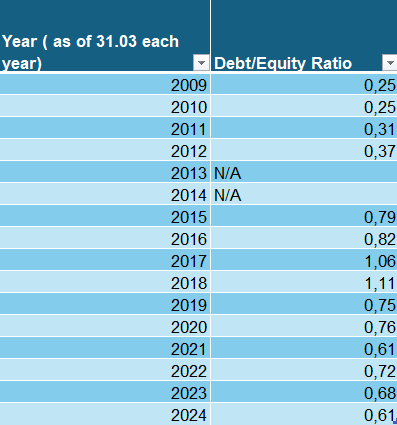
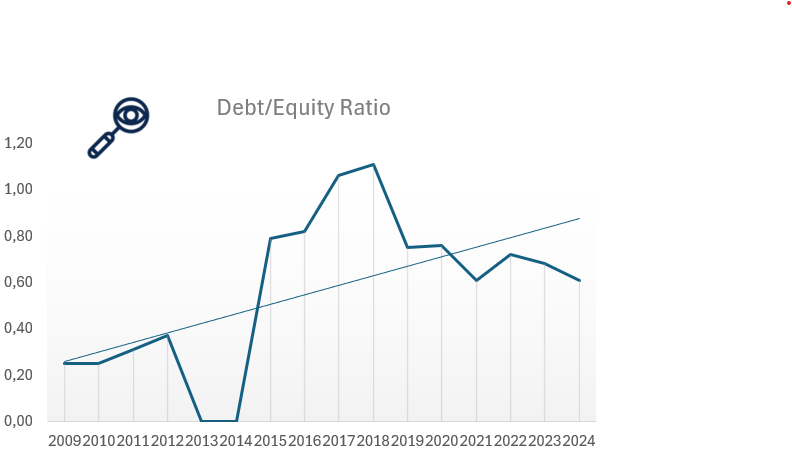
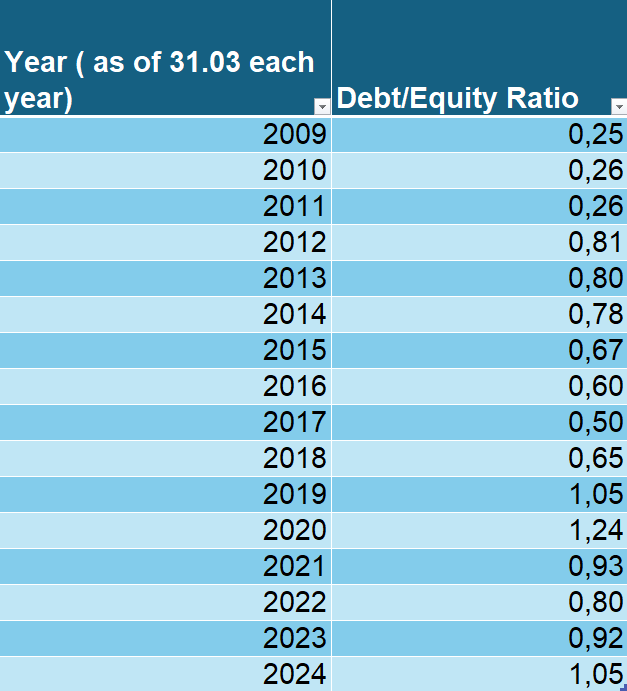
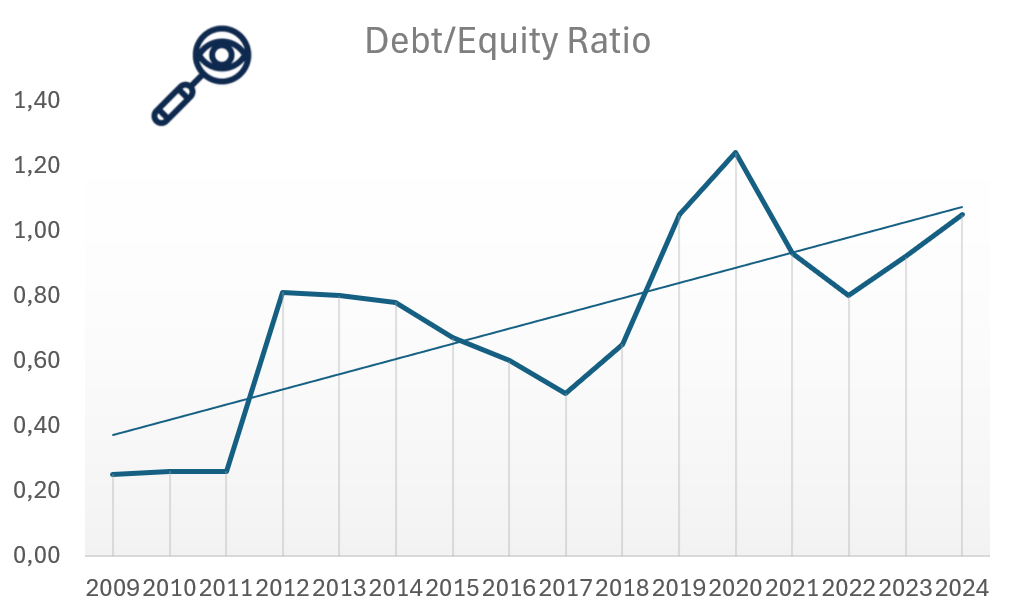
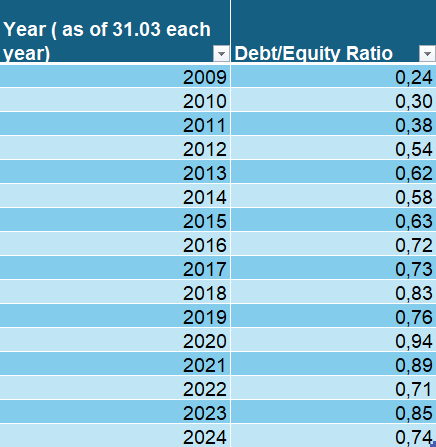
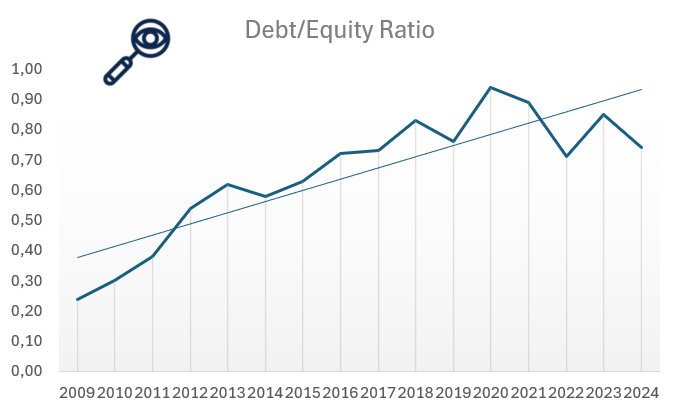
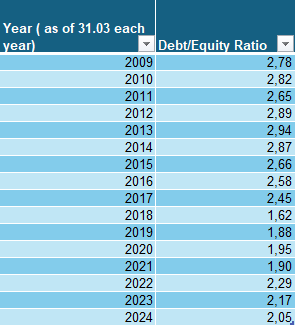
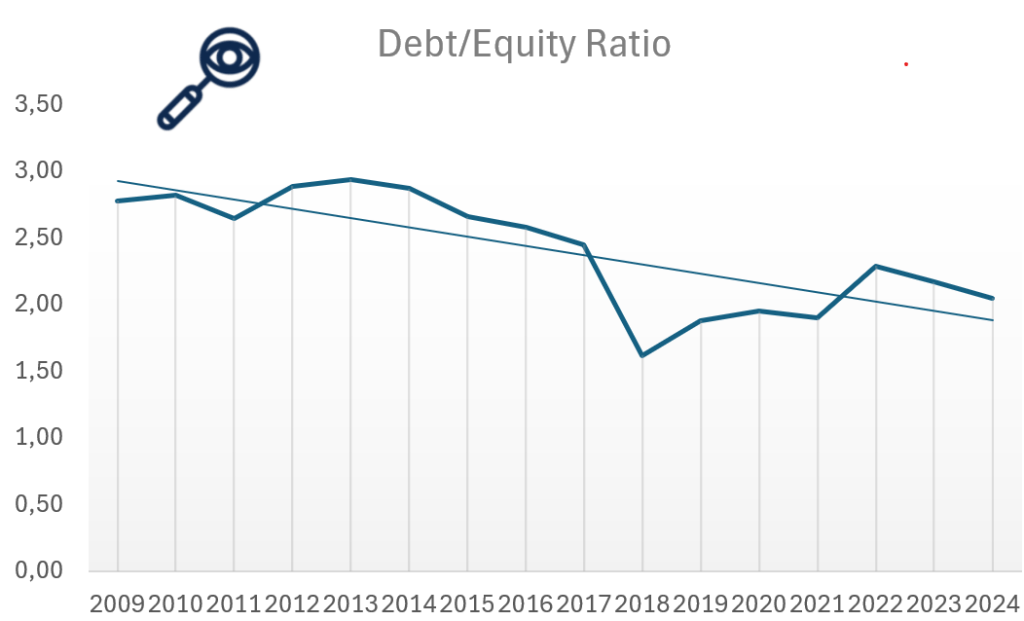
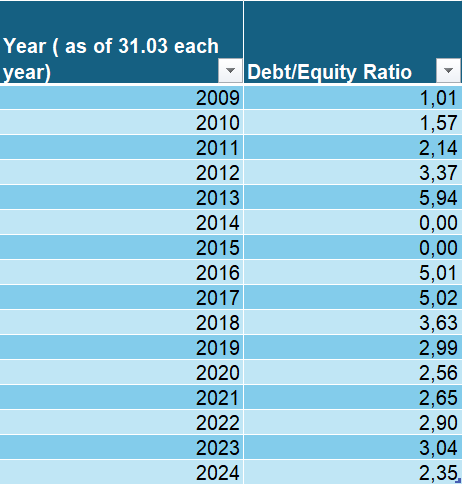
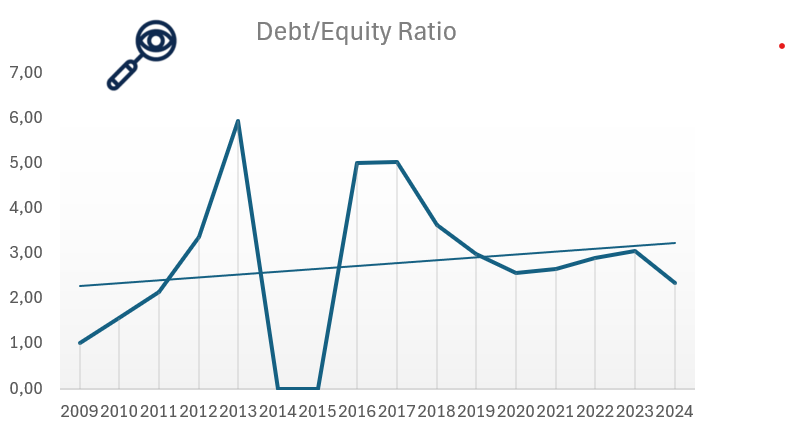
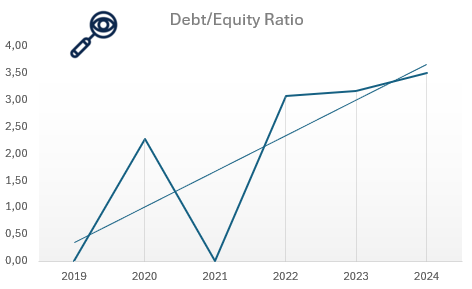
Illustration 17 and 18: Debt to Equity ratio for Boeing from 2009 to 2024
The Debt-to-Equity (D/E) ratio is an important financial metric for assessing a company’s financial leverage and risk. It compares the amount of debt a company uses to finance its operations relative to its shareholder equity. A high D/E ratio suggests the company relies more heavily on debt, increasing financial risk, especially during periods of economic stress. In contrast, a lower D/E ratio implies more conservative financing through equity, offering greater financial stability but possibly slower expansion.
Legendary value investor Warren Buffett generally prefers a D/E ratio below 0.5. However, Boeing’s total shareholder equity turned negative in recent years, meaning its liabilities now exceed its assets. As a result, the D/E ratio is no longer a meaningful metric in the traditional sense, it is effectively undefined or extremely high. This situation signals a red flag, as it reflects the long-term financial strain caused by the 737 MAX crisis, pandemic-era losses, and the need for heavy borrowing to sustain operations. Restoring equity and reducing debt will be critical to improving financial health. Until then, the absence of a meaningful D/E ratio highlights the company’s reliance on debt financing and underscores the importance of disciplined cash flow management and margin recovery in the years ahead.
Price to earning ratio (P/E)
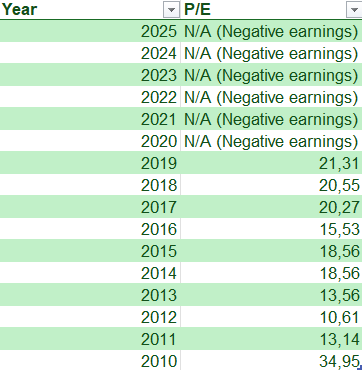
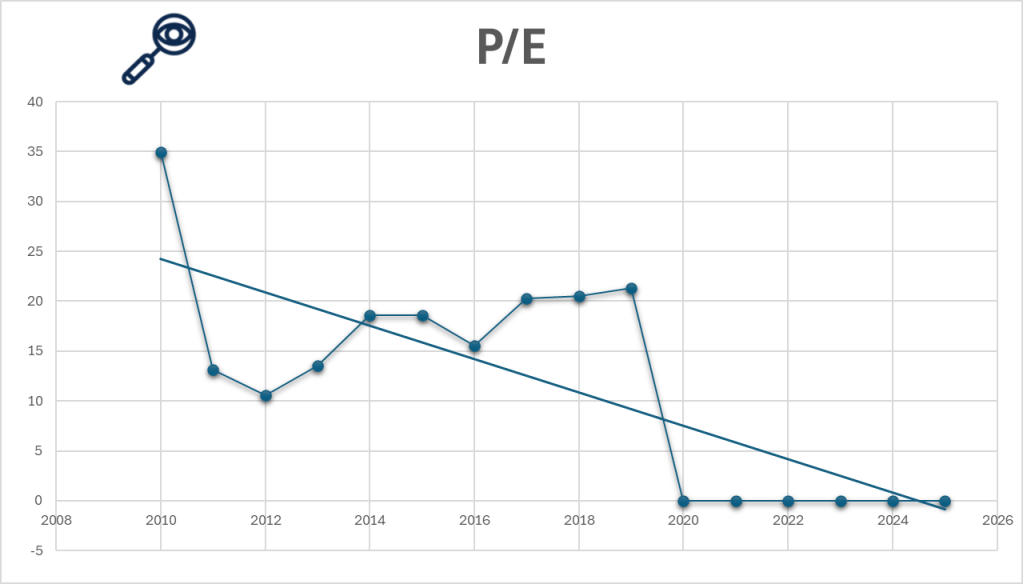
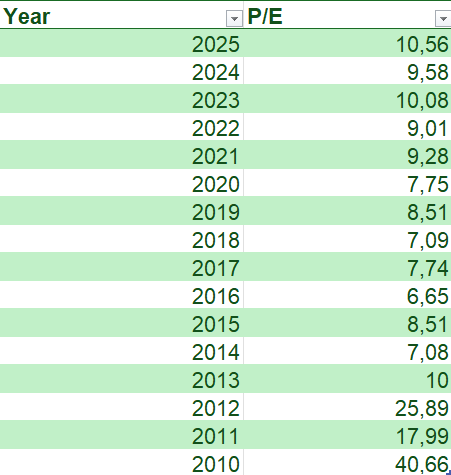
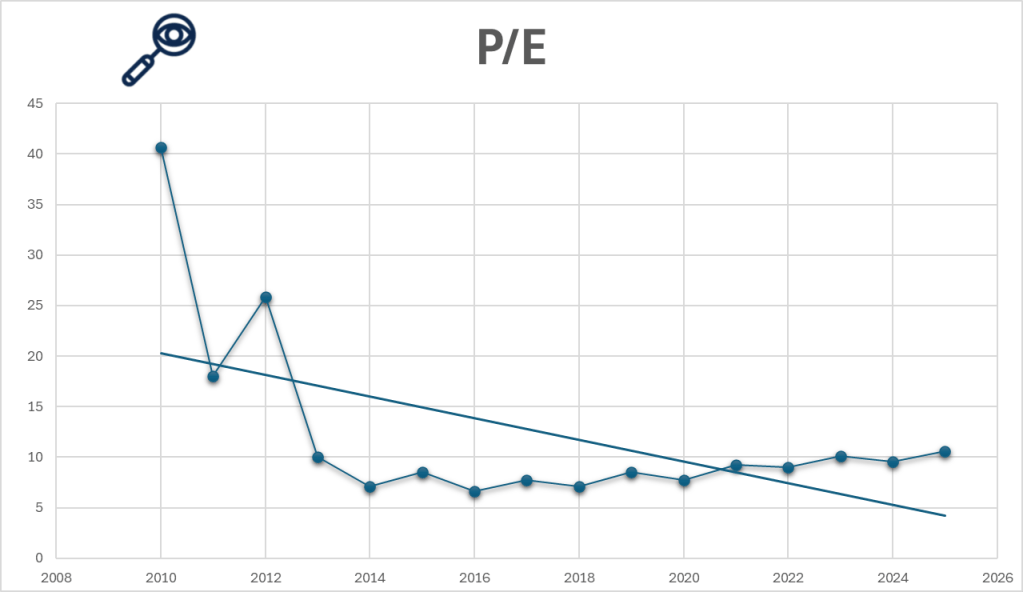
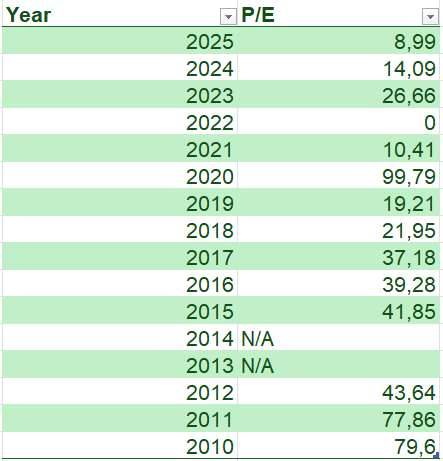
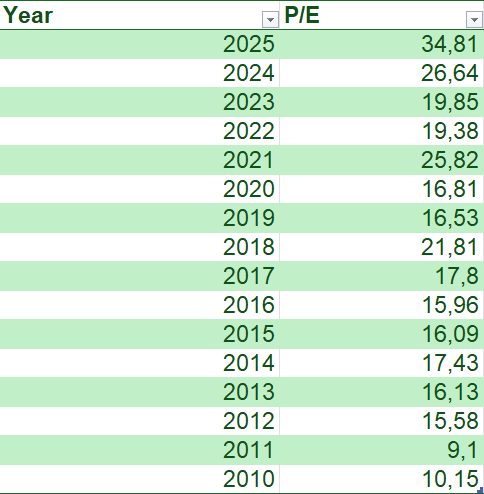
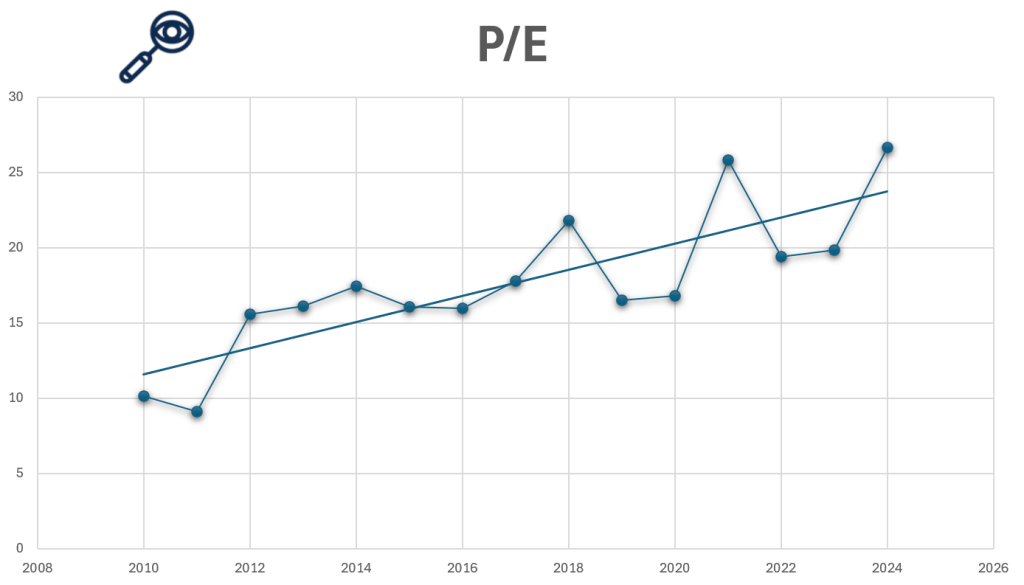
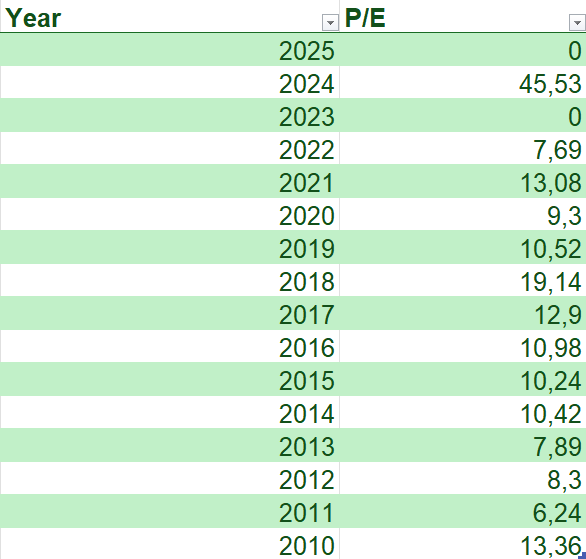
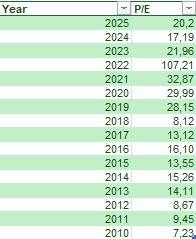
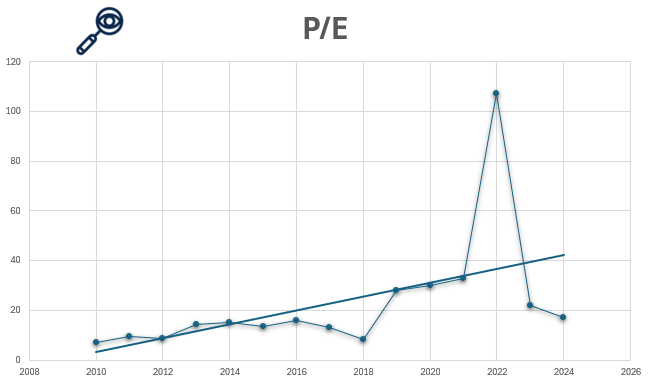
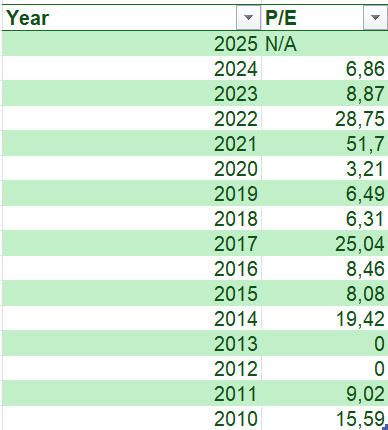
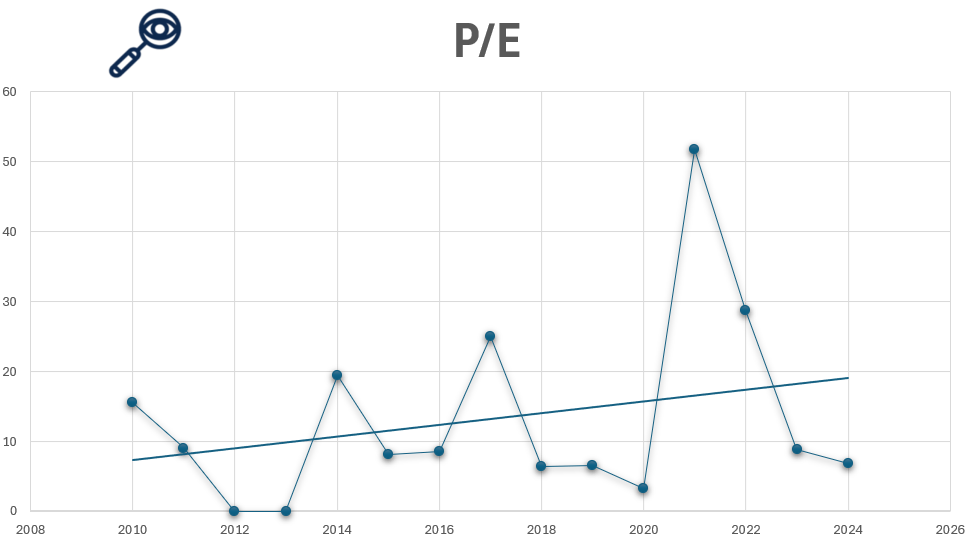
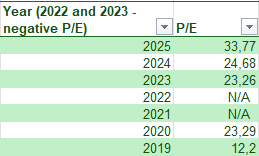
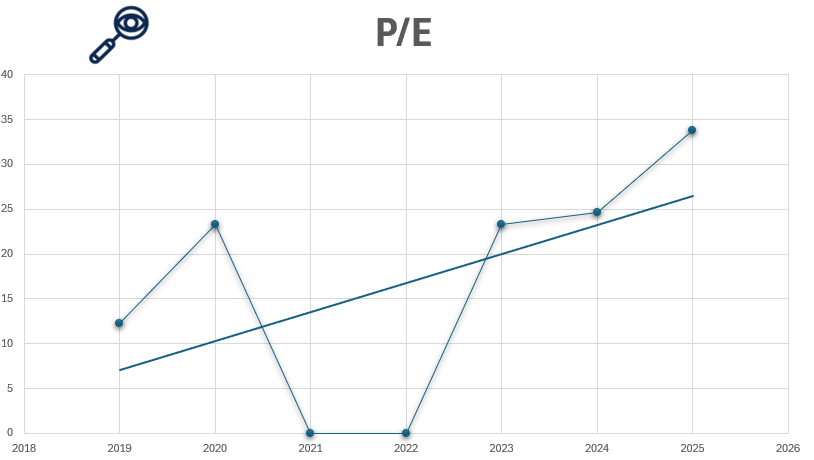
Illustration 19 and 20: Price to Earnings ratio for Boeing from 2009 to 2024
For value investors, one of the most critical metrics when evaluating Boeing’s stock is the price-to-earnings (P/E) ratio, as it helps assess whether the company is undervalued or overvalued. Even if a company has a strong brand and global footprint, paying too much for its stock can still result in poor returns. For example, imagine a business that earns $1 million annually, if offered to you for $1, it’s a steal. But if the owner asks $1 trillion, the profitability becomes irrelevant, the price is simply too high. The stock market works the same way: even good companies can be bad investments if bought at inflated prices.
Warren Buffett, a legendary value investor, generally prefers companies with a P/E ratio below 15, viewing them as attractively priced relative to earnings. In Boeing’s case, the situation is more complex. Due to multi-year losses from 2019 to 2021, Boeing’s P/E ratio has either been undefined or exceptionally high during those periods. As earnings have begun to recover, the P/E ratio remains volatile, sensitive to quarterly swings and investor sentiment. As of 2024, Boeing trades at a forward P/E ratio above 40, reflecting high expectations for recovery rather than current earnings strength.
For value investors, this elevated P/E signals caution. While Boeing’s long-term aerospace and defense prospects remain strong, the current valuation suggests that much of the recovery optimism is already priced in. Unless earnings normalize quickly and sustainably, the stock may offer limited margin of safety at current levels.
Price to Book ratio (P/B)
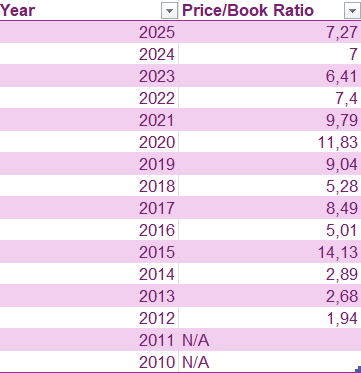
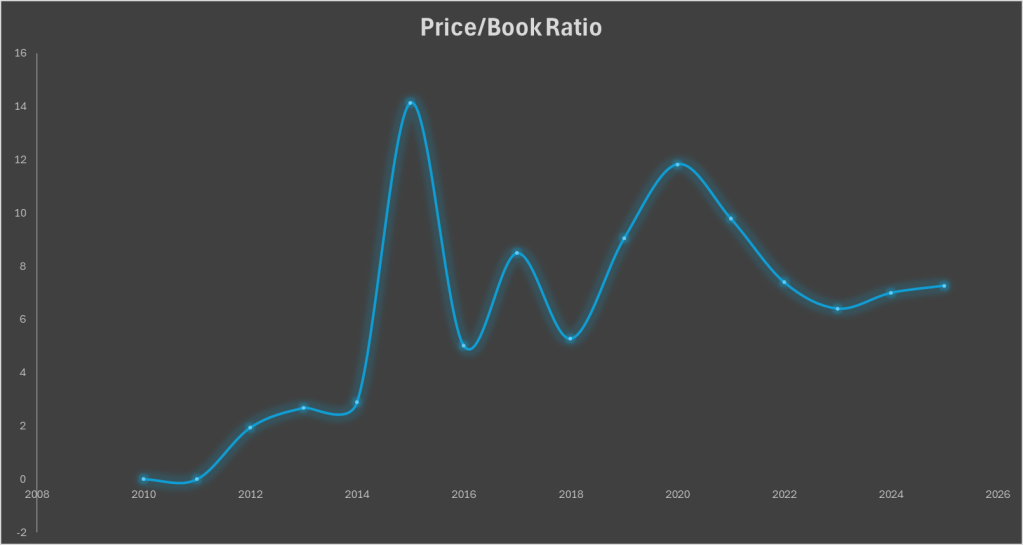
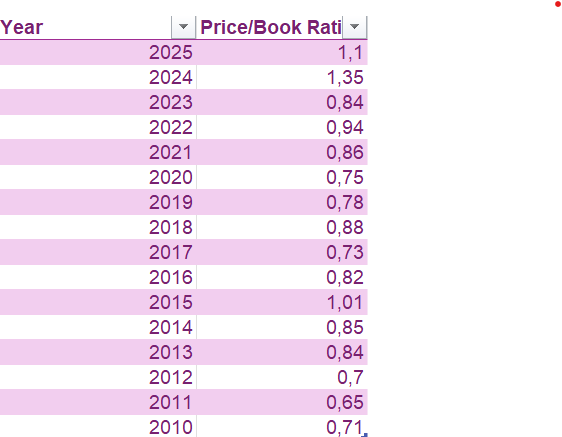
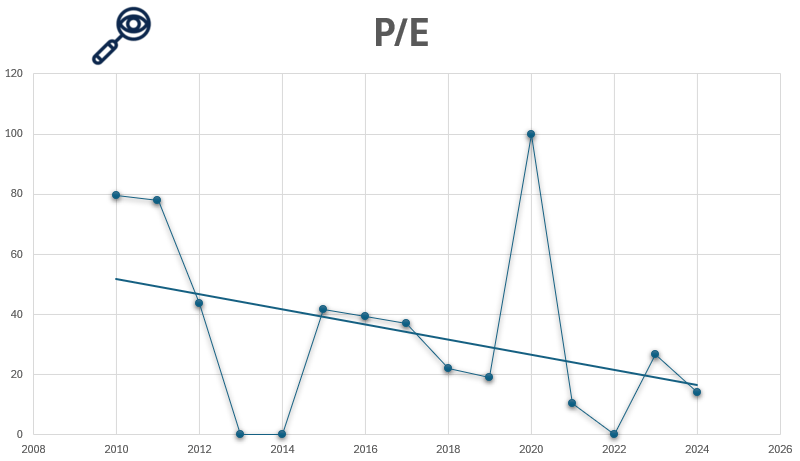
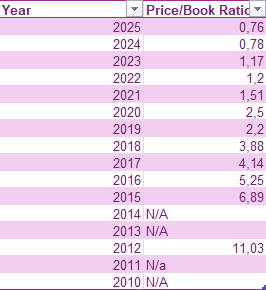
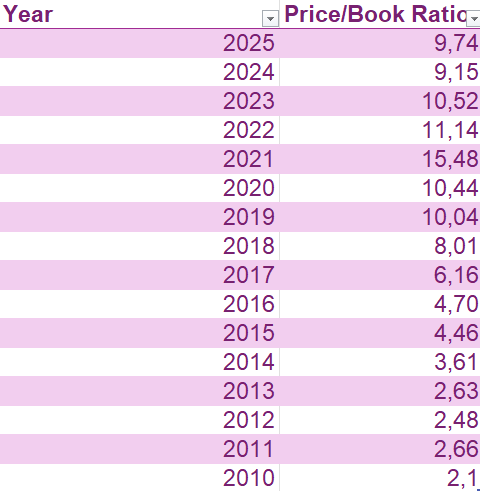
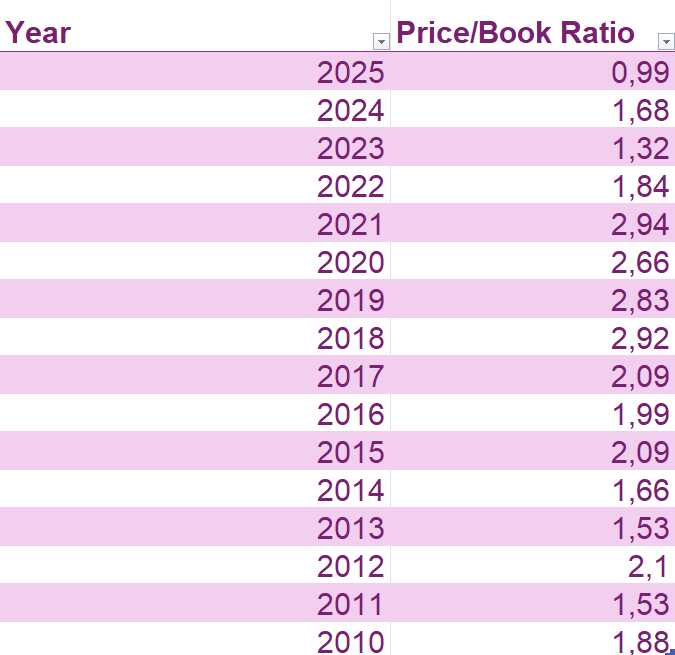
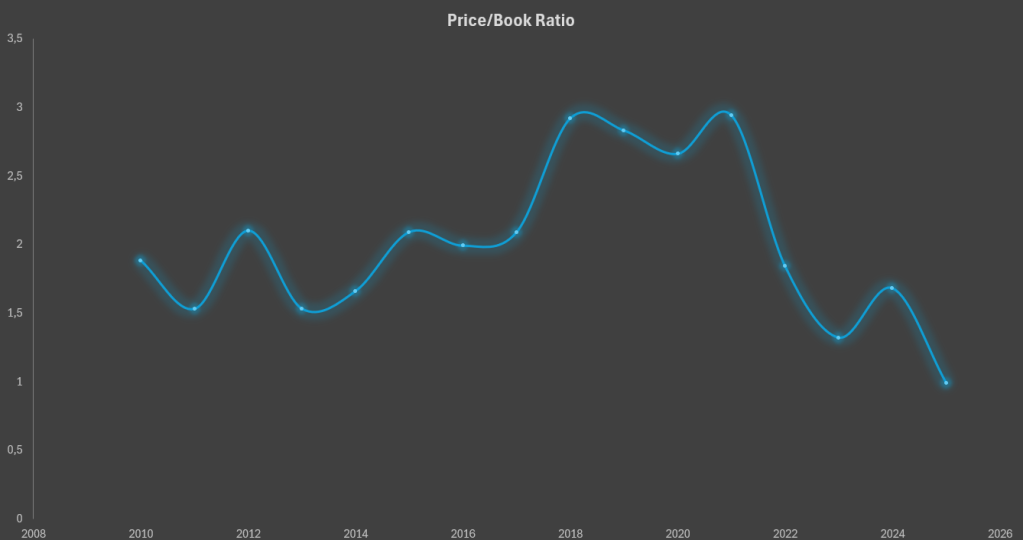
Illustration 21 and 22: Price to book ratio for Boeing from 2009 to 2024
Price-to-book value (P/B ratio) compares a company’s market value to its book value, calculated as total assets minus total liabilities. A low P/B ratio may indicate undervaluation, while a high ratio can signal overvaluation or strong growth expectations. Value investors, including Warren Buffett, often prefer P/B ratios under 1.5, ideally closer to 1.3, when seeking companies trading below their intrinsic asset value.
For Boeing, however, the P/B ratio is no longer meaningful, as the company’s shareholder equity has turned negative in recent years due to accumulated losses and rising liabilities. This means the book value per share is also negative, making the traditional P/B metric undefined.
Rather than suggesting undervaluation, this situation is a red flag, highlighting the weakened state of Boeing’s balance sheet. While Boeing continues to hold strategic value in commercial and defense aerospace, value investors are likely to remain cautious until equity becomes positive again and financial fundamentals stabilize.
Return on Investment (ROI)
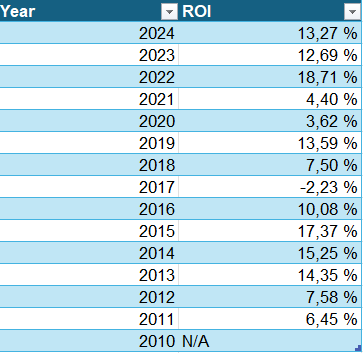
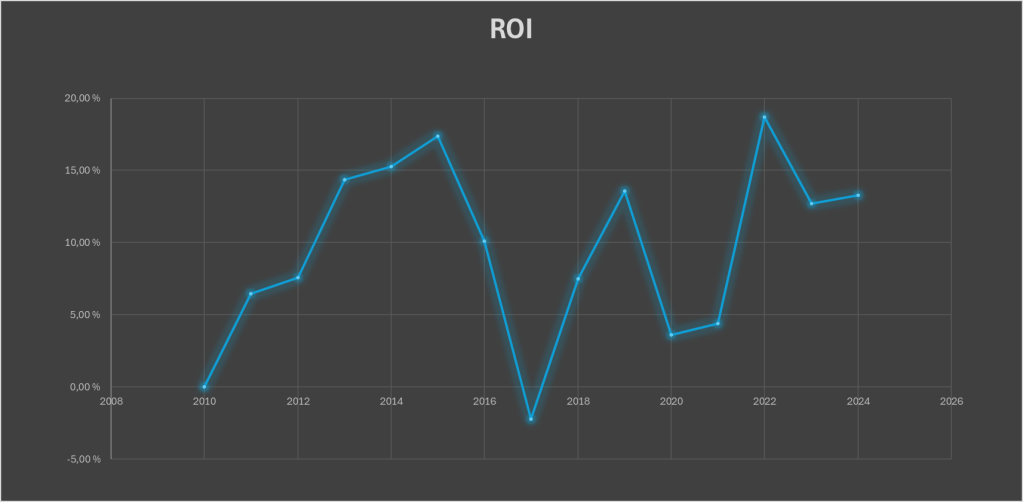
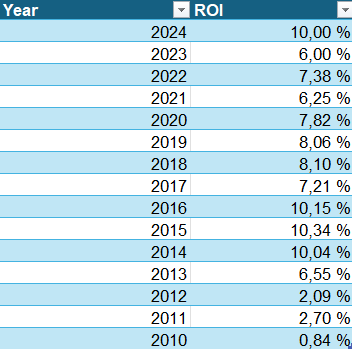
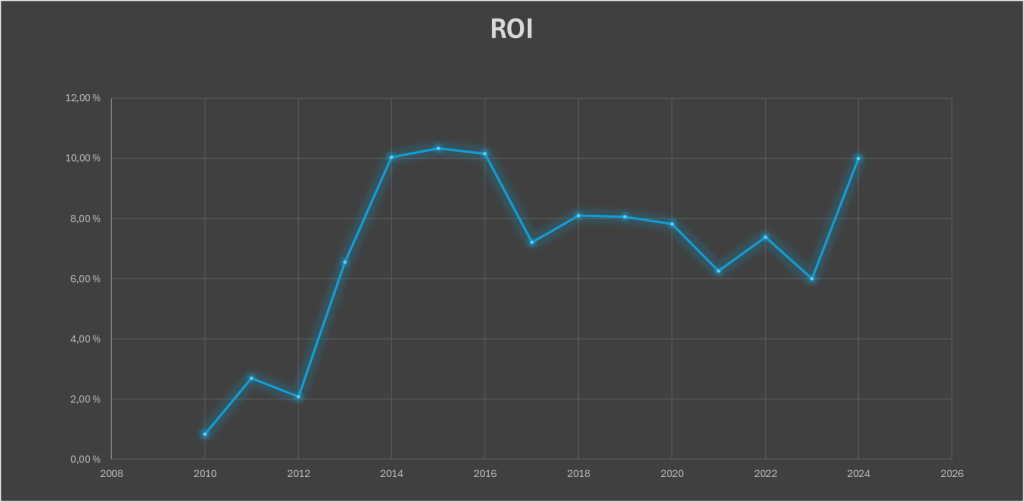
Illustration 23 and 24: Return on Investment for Boeing from 2009 to 2024
For value investors, another essential metric when evaluating Boeing’s stock is Return on Investment (ROI), as it shows how efficiently the company uses its capital to generate profits. In simple terms, ROI measures the return earned relative to the capital required to operate the business. A company may have strong revenue, but if it requires heavy capital to generate modest profits, it may not be an efficient investment. For example, if two firms earn the same profit, but one uses half the capital to do so, it’s clearly more efficient. ROI helps investors identify companies that convert capital into returns effectively—a key consideration in capital-intensive industries like aerospace.
Boeing’s ROI has been highly volatile in recent years, and negative during 2017. While ROI has improved as earnings begin to recover, it still lags behind industry expectations. Boeing’s returns have been erratic, raising questions about capital efficiency and long-term value creation. As shown in Illustration 23 and 24, this inconsistent performance reflects the ongoing challenges Boeing faces in restoring operational stability, managing debt, and navigating cost overruns. For long-term investors, this is a cautionary signal, as it suggests that the company has yet to regain full control over its capital deployment. While Boeing remains a leader in aerospace innovation, meaningful improvement in ROI will be key to signaling that the company is delivering sustainable value from its significant investments. A 13% ROI for Boeing in 2024 is a good sign, especially considering its turbulent past few years. It suggests Boeing is becoming more efficient with its capital again. However, it should be assessed alongside other metrics, like cash flow, equity, debt levels, and order backlog, to judge whether the improvement is sustainable and investable.
Dividend
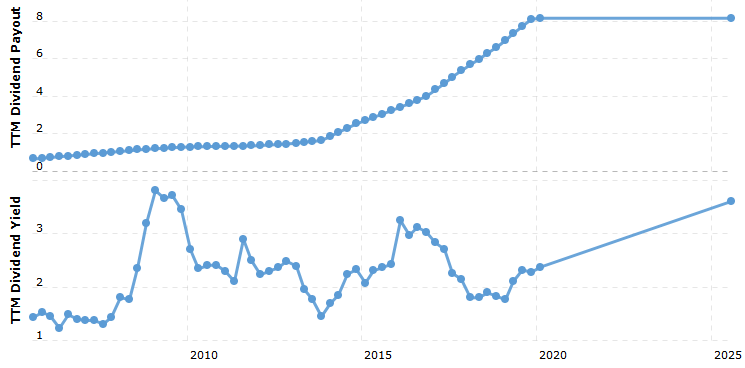
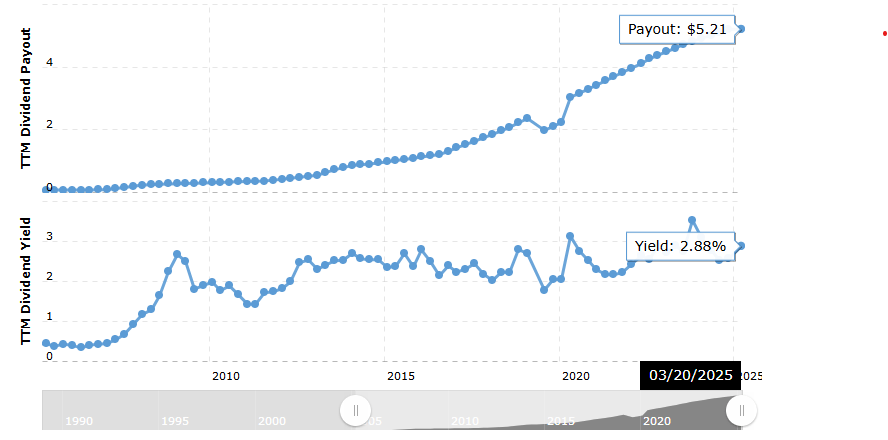
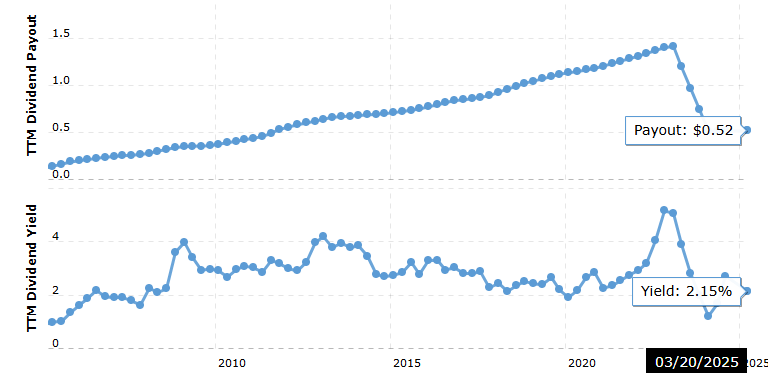
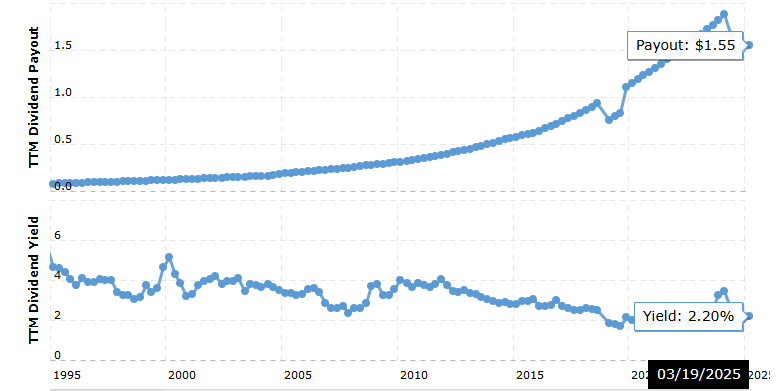
Illustration 25: Dividend Yield and dividend payout ratio from 2005 to 2025 for Boeing
Boeing has historically been a reliable dividend payer, with its annual dividend reaching as high as $2.06 per share in early 2020 and an average dividend yield around 2.5% over the past five years. However, Boeing suspended dividend payments in March 2020 amid financial challenges from the 737 MAX crisis and the COVID-19 pandemic. Since then, no dividends have been issued.
In 2024, Boeing reported a negative earnings per share (EPS) of approximately -$18.36, and while its dividend payout ratio would have been around 48% based on prior earnings patterns, the suspension means the actual payout ratio is effectively zero. This pause in dividends is a red flag for income-focused investors who value steady cash returns. That it has suspended dividends is a big red flag for investors.
Insider Trading
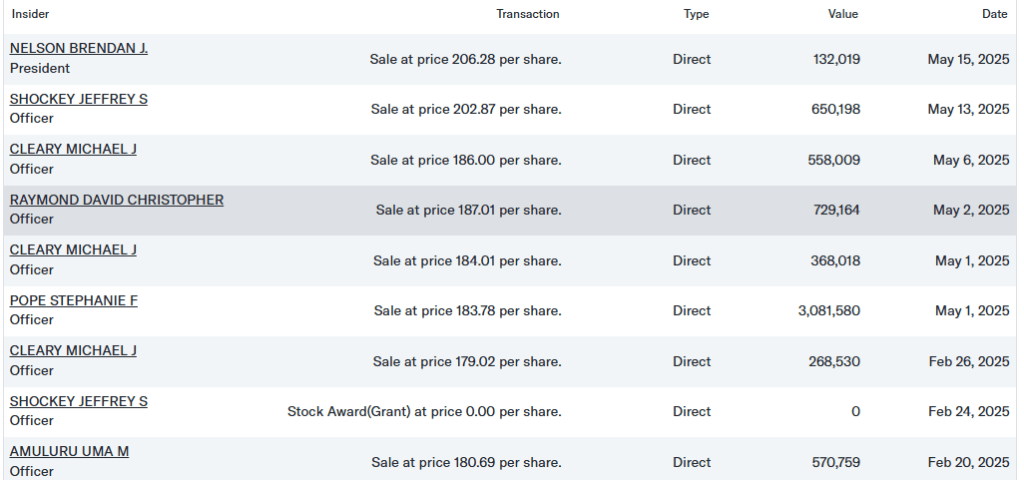
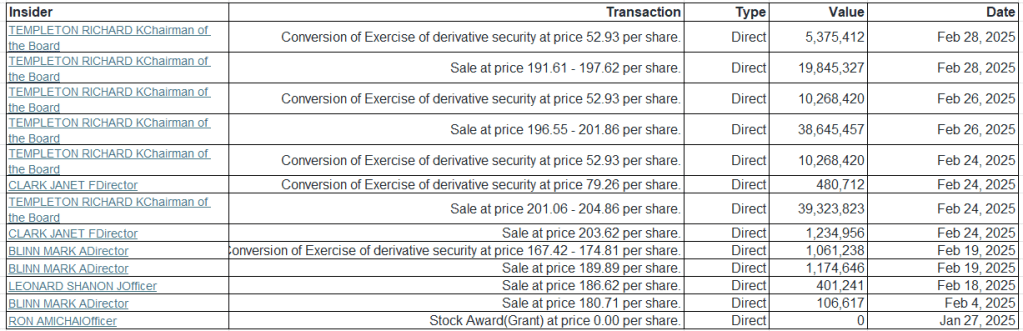
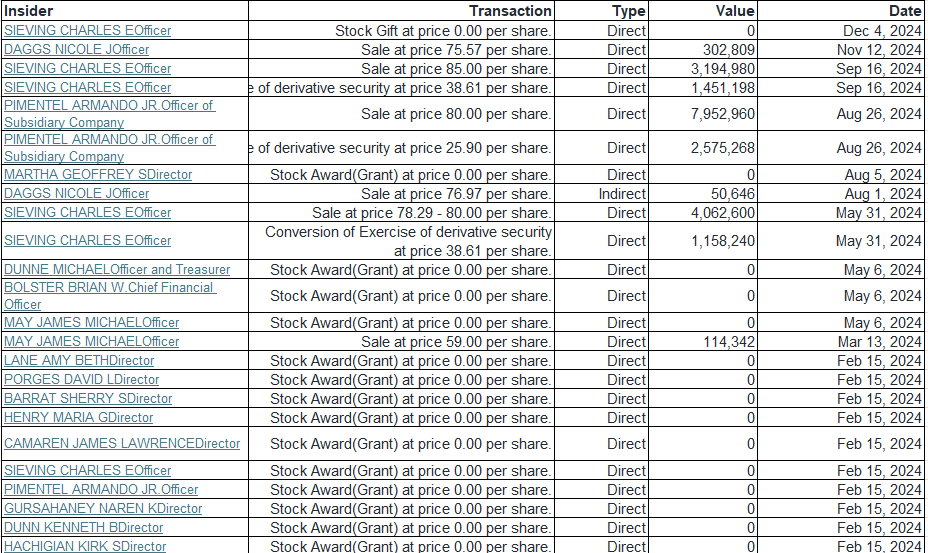
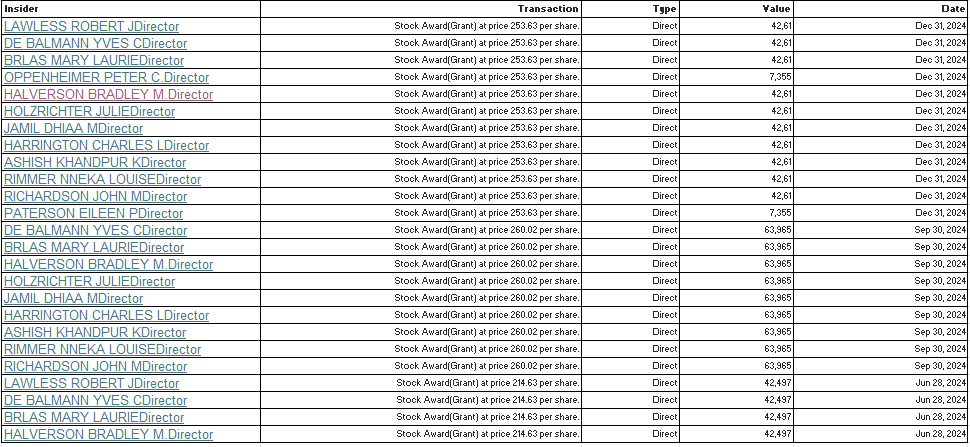
Illustration 26: Recent insider trading at yahoo, gathered from yahoo finance
Recent insider trading activity at Boeing has shown a significant increase in insider selling, which may raise concerns for investors. Between early and mid-May 2025, multiple senior executives, including Boeing’s Executive Vice Presidents and Presidents of major divisions sold substantial amounts of company stock, collectively worth several million dollars. While insider selling can be part of routine financial planning or diversification, the concentrated timing and volume of these sales are noteworthy.
Insider selling at this level can be interpreted as a potential red flag, as it may suggest that insiders have less confidence in the company’s near-term prospects or are taking advantage of current stock prices before possible declines. For value investors, such activity warrants closer scrutiny and signals the importance of monitoring Boeing’s forthcoming earnings results, operational updates, and market conditions.
Other Company Info
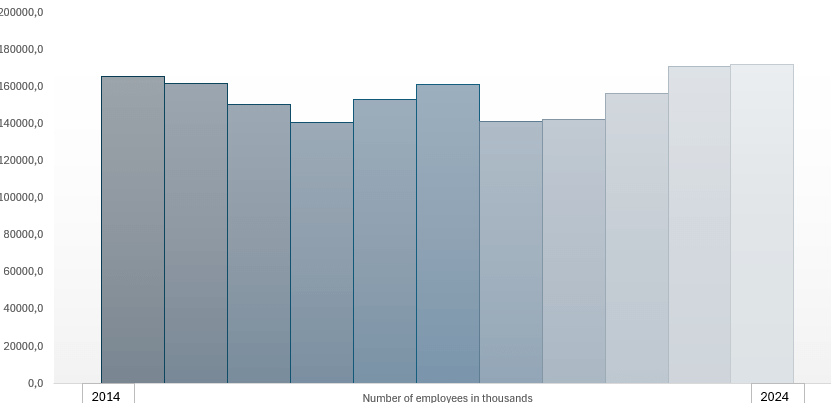
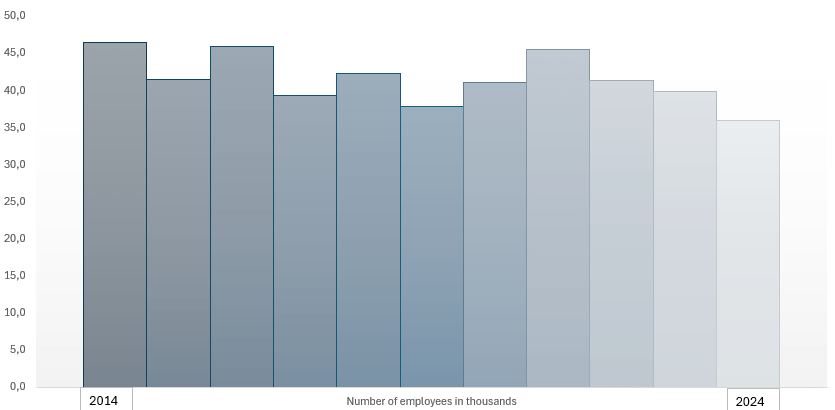
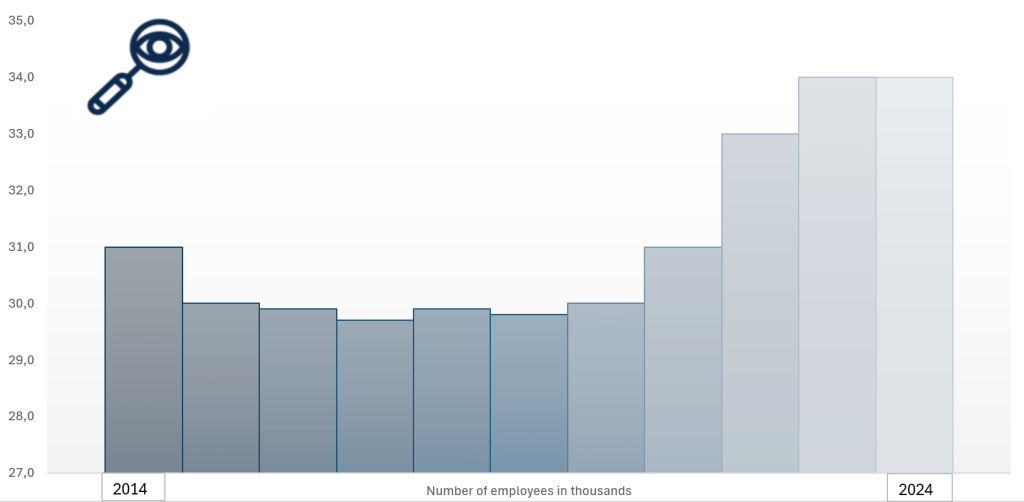
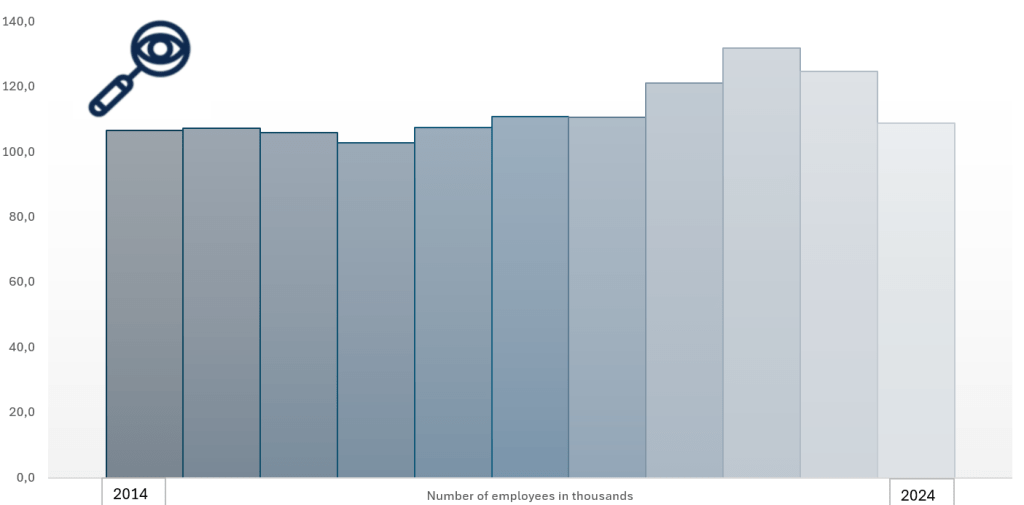
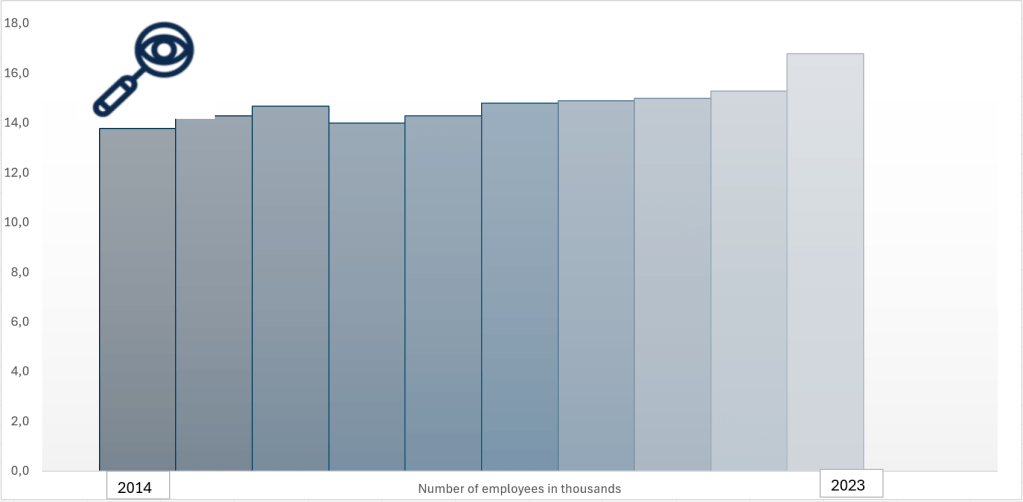
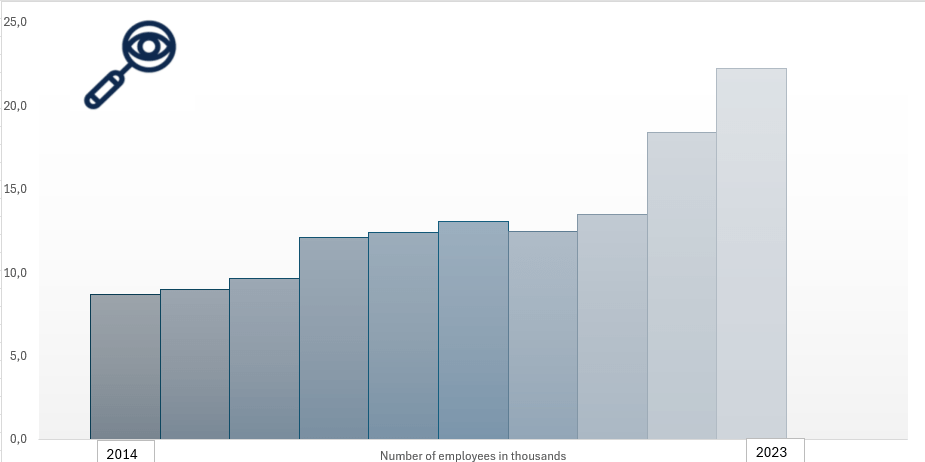
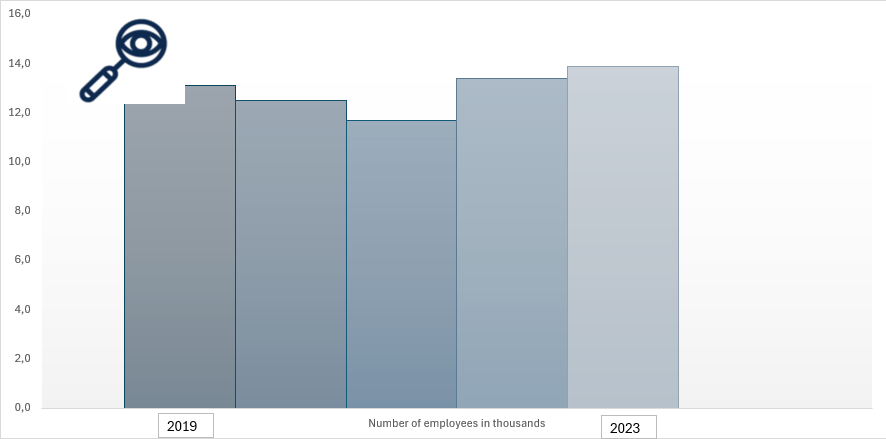
Founded in 1916, The Boeing Company is one of the world’s largest and most respected aerospace manufacturers, known for its commercial aircraft, defense systems, and space technologies. As of 2024, Boeing employs approximately 140,000 people globally, reflecting its extensive operations in manufacturing, engineering, research, and services. The company is publicly traded on the New York Stock Exchange (NYSE) under the ticker symbol BA and operates within the Industrials sector, specifically in the Aerospace & Defense industry.
Boeing is headquartered at 100 North Riverside Plaza, Chicago, Illinois, USA. As of 2024, the company has approximately 560 million shares outstanding, with a market capitalization of around $140 billion USD. For more information, visit Boeing’s official website: https://www.boeing.com.
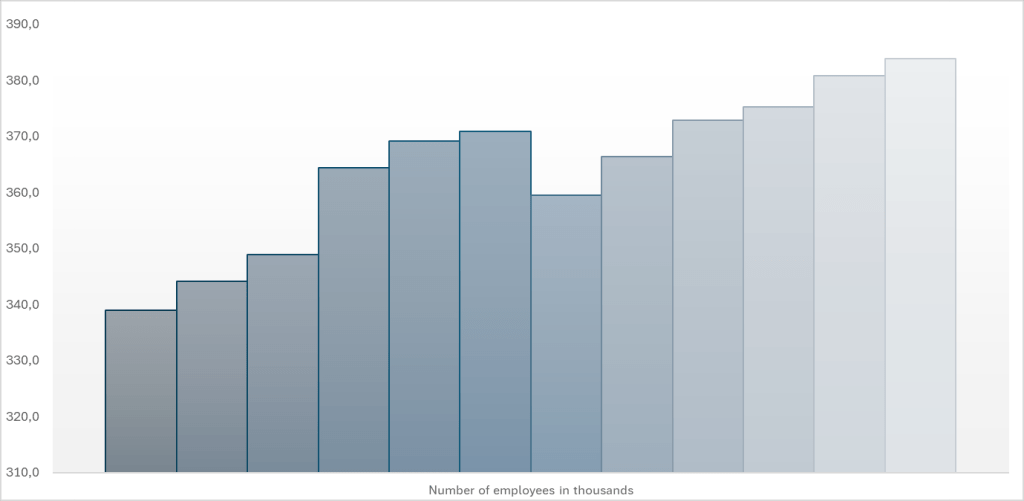
Illustration 17: Number of employees and location of Boeing.
Final Verdict
The Boeing Company currently faces significant challenges that make it a risky investment, especially for value and income investors seeking stability. Despite being a major player in aerospace, Boeing’s financials reveal several red flags: the company has negative shareholder equity, high debt levels, and low cash reserves, which limit its financial flexibility and increase risk during downturns.
Boeing’s earnings have been volatile, and recent dividend cuts have diminished its appeal to income-focused investors. Ongoing production issues, delays, and market uncertainties further cloud the company’s near-term prospects. While Boeing is investing in innovation and defense contracts, these efforts have yet to translate into consistent profitability or a stronger balance sheet.
Overall, Boeing’s current financial health and operational risks suggest caution. It may not be suitable for conservative investors, and those considering it should be prepared for potential volatility and a prolonged recovery period. This makes Boeing a less attractive choice compared to more stable industry peers.
Toyota Motor Corporation is a globally renowned Japanese multinational automotive manufacturer, widely regarded as one of the world’s leading innovators in mobility, automotive engineering, and sustainable transportation.
Illustration 1: he Toyota logo, a symbol of trust, innovation, and global mobility.
Headquartered in Toyota City, Japan, the company is best known for its high-quality vehicles and pioneering work in hybrid technology, but its operations span a broad spectrum including robotics, AI, autonomous driving, and hydrogen fuel cell systems.
Unlike many Western automakers that evolved in tandem with the American and European car industries, Toyota carved a unique path grounded in the principles of Kaizen (continuous improvement) and Just-In-Time manufacturing, revolutionizing global automotive production with the Toyota Production System (TPS). Its reputation for reliability, efficiency, and innovation has made it a household name in markets around the world.
Toyota is consistently ranked among the top global automakers by volume and market capitalization. It has spearheaded the automotive industry’s shift toward sustainability through its leadership in hybrid technology (beginning with the Prius) and its bold push into hydrogen-powered and battery electric vehicles. With a growing focus on AI, connected vehicles, and mobility-as-a-service, Toyota continues to shape the future of transportation.
History
Toyota was founded in 1937 by Kiichiro Toyoda, evolving from Toyoda Automatic Loom Works. Initially focused on producing passenger cars for the Japanese market, the company quickly established itself with models like the Toyota AA and developed a reputation for durable vehicles in the post-war period.
Illustration 2: The first Toyota passenger car was the Toyoda Model AA
The real global breakthrough came during the 1970s and 1980s, when Toyota expanded aggressively into North America and Europe. Its compact, fuel-efficient cars, such as the Corolla and Camry, gained popularity during the oil crisis, helping it gain a foothold in key international markets.
Toyota became a global icon of manufacturing excellence with the development of the Toyota Production System (TPS) which is a manufacturing philosophy that transformed supply chains worldwide. In 1997, it launched the Prius, the world’s first mass-produced hybrid electric vehicle, cementing Toyota’s role as an environmental pioneer in the auto industry.
In the 2010s, Toyota expanded into next-generation mobility, investing in AI research, autonomous driving (under its subsidiary Woven by Toyota), and alternative energy sources such as hydrogen fuel cells (Mirai). The company has continued to build its brand as not just an automaker but a mobility solutions provider.
Today, Toyota operates over 50 manufacturing facilities worldwide and sells vehicles in more than 170 countries. It remains the world’s largest automaker by units sold, combining innovation with a deep commitment to quality and sustainability. Its reputation is that their cars will last for ever due to their quality.
Operations and Production
Portfolio
Toyota is a car company and it’s core operations center around the development, manufacturing, and sale of automobiles, including sedans, SUVs, trucks, and commercial vehicles. Its flagship models include the Corolla (the world’s best-selling car), Camry, Land Cruiser, Hilux, RAV4 and Prius hybrid.
Illustration 3: Toyota Land Cruiser is one of the most famous Toyota cars
The Toyota Motor Corporation owns several key brands:
Toyota (mainstream brand)
Lexus (luxury vehicles)
Daihatsu (compact cars and mini-vehicles)
Hino (commercial trucks and buses)
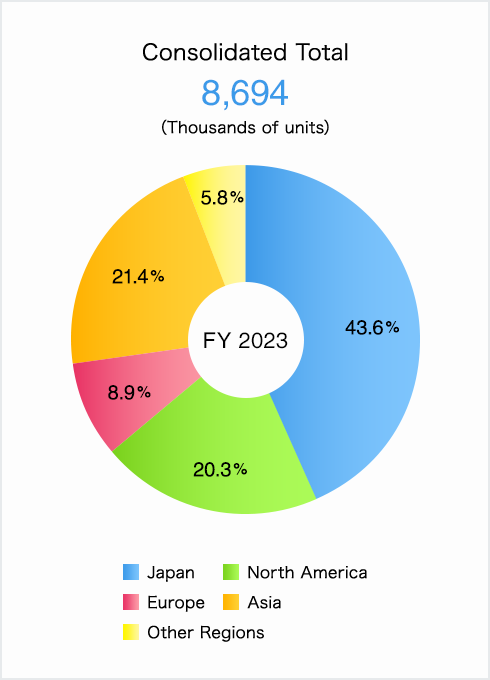
Toyota sells cars in all countries, but its biggest markets are asia and Japan.
Illustration 4: Illustration of the biggest markets of Toyota
Electric and Hybrid Cars
Toyota has been a pioneer in hybrid technology since the launch of the Prius in 1997, the world’s first mass-produced hybrid electric vehicle. This bold move not only positioned Toyota as a technological leader but also sparked a global movement toward cleaner and more fuel-efficient vehicles. As of today, Toyota has sold over 20 million hybrid vehicles worldwide, contributing significantly to global CO₂ emissions reduction in the transportation sector.
Toyota’s hybrid portfolio is among the most comprehensive in the industry, spanning sedans, SUVs, and even commercial vehicles. Models like the RAV4 Hybrid, Corolla Hybrid, and Camry Hybrid continue to perform strongly in markets across Asia, North America, and Europe. Toyota is known for it’s longevity, quality and sustainability and it has proved that it can produce hybrid cars that are as solid as its gasoline cars.
Illustration 5: Prototype of a new Toyota car that is to come out by 2026
In addition to hybrids, Toyota is expanding its presence in battery electric vehicles (BEVs). Under its new “bZ” (beyond zero) sub-brand, Toyota has launched the bZ4X, a fully electric crossover SUV, and plans to introduce over 10 new BEV models by 2026.
Toyota also produces hydrogen-powered cars as it intorduced Toyota Mirai, one of the few hydrogen-powered cars available to the public, in 2014. Toyota is also investing heavily in solid-state battery research. These next-generation batteries promise higher energy density, faster charging times and greater thermal stability, which could solve many of the limitations of current lithium-ion technology. Toyota aims to begin commercial production of solid-state batteries as early as 2027–2028, potentially reshaping the EV landscape.
Autonomous Driving, Robotics and AI
Under its innovation hub Woven by Toyota, the company is developing technologies for autonomous vehicles, smart cities, and connected mobility. Toyota’s Guardian system enhances driver safety through AI-driven assistive features, while its Chauffeur system aims for full autonomy in the future.
Toyota is also building Woven City, a fully connected smart city near Mt. Fuji to test smart infrastructure, robotics, and autonomous vehicles in real-life settings.
Beyond cars, Toyota is developing robotics for elderly care, manufacturing automation, and personal assistance. It has also invested in AI research, including partnerships with Stanford and MIT, and launched the Toyota Research Institute (TRI) to explore machine learning, robotics, and materials science.
Key Competitors
Toyota operates in one of the most competitive and rapidly evolving industries, facing rivals across traditional automaking, electric mobility, autonomous driving, and smart mobility ecosystems. Its competitors can be grouped into three main categories:
1. Traditional Global Automakers
Volkswagen Group: Toyota’s closest global rival by sales volume. Volkswagen has committed heavily to electrification, launching the ID. series of EVs and investing over €180 billion in digital and sustainable technologies. Its scale and global manufacturing footprint mirror Toyota’s, making the two firms frequent contenders in both developed and emerging markets.
General Motors (GM): Strong in North America and China, GM is transitioning aggressively to EVs under its Ultium battery platform and brands like Chevrolet, GMC, and Cadillac. GM’s Cruise division is also a key player in autonomous mobility.
Ford Motor Company: Ford competes in global markets, particularly in trucks, SUVs, and commercial vehicles. Its F-150 Lightning electric pickup and investment in self-driving (via Argo AI, now winding down) reflect its growing focus on innovation.
Honda: Fellow Japanese automaker and frequent rival in efficiency, reliability, and innovation.
2. Electrification and Mobility Disruptors
Tesla: As the world’s leading electric vehicle manufacturer, Tesla has redefined customer expectations in EV range, software, and direct-to-consumer sales. While Toyota is far ahead in hybrids and hydrogen, Tesla currently leads in BEV market share and autonomous software development.
BYD: China’s largest EV maker, BYD has quickly become a dominant force in battery-electric and plug-in hybrid vehicles. With vertical integration of battery and semiconductor manufacturing, BYD poses a strong challenge to Toyota’s market position in Asia and Latin America.
Hyundai-Kia: Rapidly growing with vehicles like the Ioniq 5 and EV6, the Hyundai Motor Group also invests heavily in hydrogen fuel cells, autonomous driving (via Motional), and design innovation. Hyundai’s ambition and product breadth increasingly rival Toyota’s.
Illustration 6: A Toyota dealership
3. Tech Giants and AI Innovators
Apple and Google (Alphabet): Though not automakers per se, both companies are developing autonomous driving software and in-vehicle infotainment platforms. Google’s Waymo and Apple’s rumored “Apple Car” project symbolize the convergence of automotive and digital ecosystems.
NIO, XPeng, and Li Auto: Chinese EV startups are innovating rapidly in autonomous driving, digital UX, and direct sales models, supported by China’s strong EV policies.
Competitive Advantage
Toyota’s most defining advantage lies in its lean manufacturing and Kaizen culture. This system allows Toyota to produce high-quality vehicles with minimal waste and exceptional efficiency—offering a competitive edge in both cost control and scalability.
Its early leadership in hybrid technology has given Toyota unmatched experience in powertrain integration and fuel efficiency. Toyota’s scale, supply chain mastery, and reputation for reliability allow it to produce high-quality vehicles at competitive prices.
Rather than focusing solely on battery electric vehicles, Toyota has embraced a diverse electrification roadmap: hybrids, plug-in hybrids, BEVs, and hydrogen fuel cell vehicles. This approach gives Toyota flexibility across different markets and infrastructures, particularly in countries where charging infrastructure is underdeveloped.
Toyota is consistently ranked among the top brands for quality, safety, and long-term dependability. Its vehicles often command premium resale value and customer loyalty, helping sustain market share in competitive regions. Toyota invests heavily in R&D (over ¥1.2 trillion annually), with a focus on AI, robotics, connected mobility, and next-generation batteries. Its internal ventures like the Toyota Research Institute (TRI) and Woven by Toyota exemplify its commitment to transforming from a carmaker into a mobility technology company
Illustration 7: Toyota Prius is a pioneer when it comes to hybrid cars
Future Outlook
Toyota is at a pivotal moment as the global auto industry transitions to electrification, autonomy and digital mobility. The company aims to sell 3.5 million battery electric vehicles annually by 2030, alongside continued leadership in hybrids and hydrogen.
Its investments in solid-state batteries, next-gen EV platforms and smart cities indicate a long-term strategy rooted in technological leadership and environmental responsibility.
As governments tighten emissions regulations and consumers demand cleaner, smarter mobility solutions, Toyota’s hybrid legacy, global reach, and evolving tech ecosystem position it as a mobility leader for the 21st century.
Stock Analaysis
In this section we will analyze Toyota’s stock to see if it is a good stock to buy or not. Our philosophy is value investing meaning that we try to find good quality companies that are undervalued. However, we will give a holistic overview so all kind of investors with different philosophies can judge the stock for themselves.
Revenue and Profits
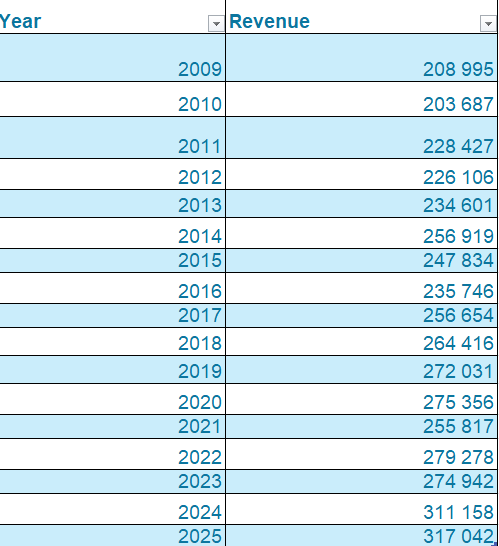
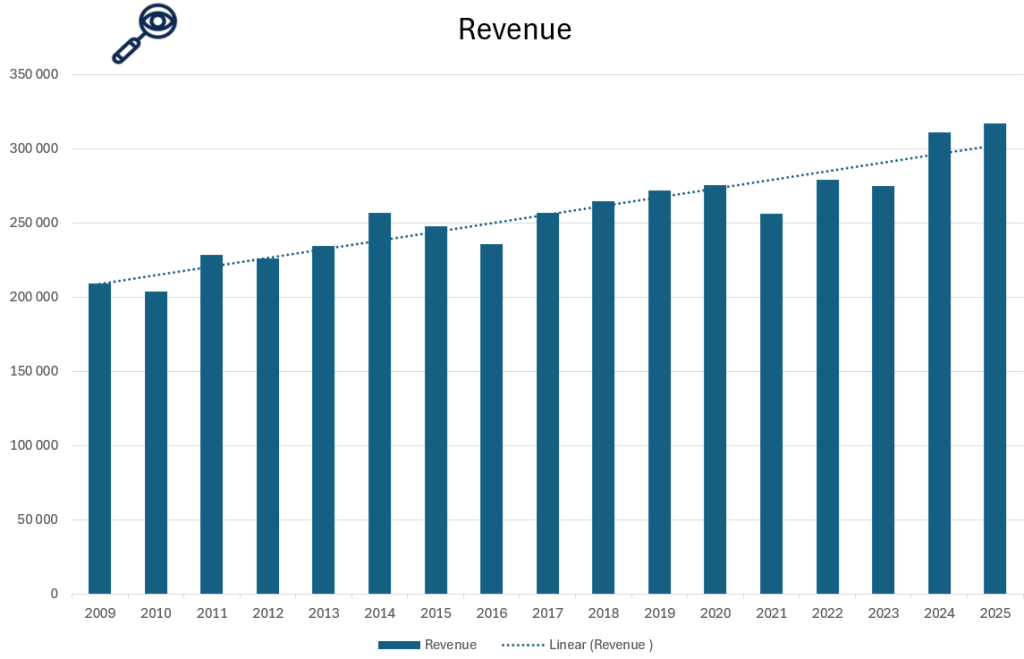
Illustration 8 and 9: Revenue of Toyota Motor Corporation from 2009 to 2025
As shown in Illustrations 6 and 7, Toyota has maintained steady and consistent revenue growth from around USD 209 billion in 2009 to around 317 billion in 2025, without major spikes or declines. This smooth upward trajectory is a strong green flag, reflecting Toyota’s disciplined operations, global market balance, and long-term strategy.
Even through global disruptions like COVID-19 and supply chain challenges, Toyota’s lean manufacturing and diversified product mix helped it maintain growth. Its cautious but forward-looking investments in hybrids, EVs, hydrogen, and smart mobility have supported revenue expansion without volatility.
Overall, Toyota’s financial performance is a green flag for value investors as it shows a company that is stable, has increased its revenue steadily over time and been able to grow and handle crisis.
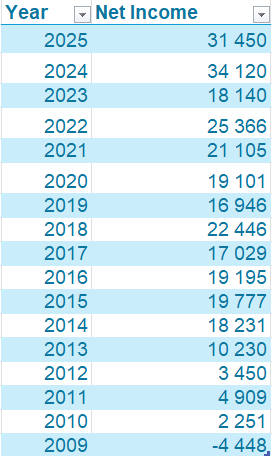
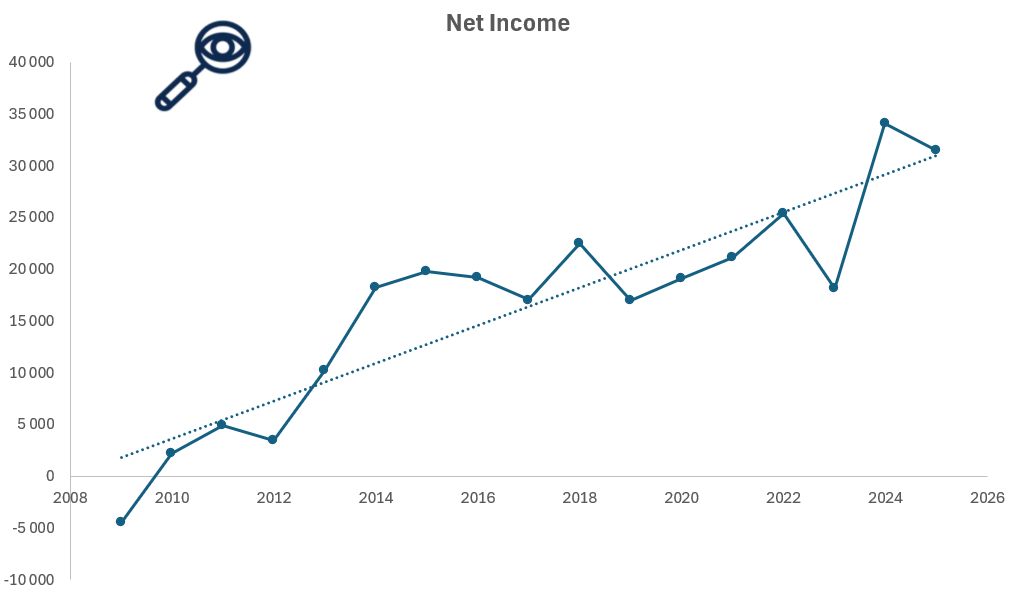
Illustration 10 and 11: Net Income of Toyota Motor Corporation from 2009 to 2025
Net income is a crucial metric to evaluate when determining whether a company is a worthwhile investment. It represents a company’s net profit or loss after accounting for all revenues, income items, and expenses, calculated as Net Income = Revenue – Expenses.
As seen in Illustrations 10 and 11, Toyota’s net income has followed a stable and upward trend from 2009 to 2025, closely mirroring its consistent revenue growth. Unlike many global automakers or tech firms, Toyota has avoided major profit volatility, thanks to its efficient cost structure, strong global demand, and disciplined investment strategy. This alignment between revenue and net income is a strong green flag, reflecting Toyota’s ability to innovate while maintaining healthy margins and financial stability.
Revenue Breakdown
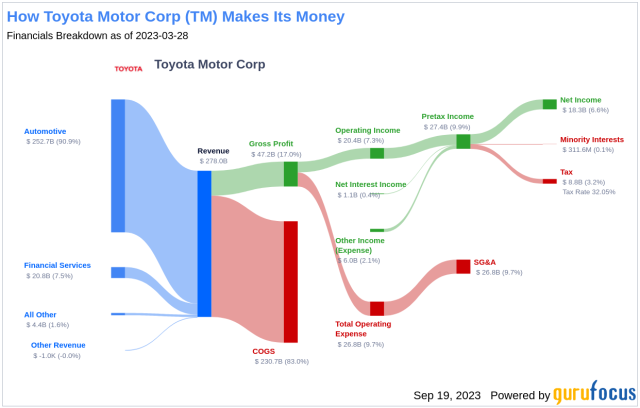
Illustration 12: Revenue breakdown for Toyota Motor Corp. made by guru focus
As shown in Illustration 12, Toyota’s core automotive operations remain its largest revenue driver, consistently contributing over 90% of total revenue. This includes sales of passenger vehicles, commercial trucks, and parts across global markets. Toyota’s diverse portfolio, from the Toyota Corolla and RAV4 to Lexus luxury models and Hilux pickups, provides broad appeal across customer segments and regions. Its leadership in hybrid technology has been a key factor in sustaining strong vehicle demand and repeat sales.
In addition to vehicle sales, Toyota’s financial services segment, offering leasing, loans, and insurance, accounts for approximately 7.5% of total revenue. This arm supports the company’s retail strategy by providing in-house financing for customers and dealers in major markets like the U.S., Europe, and Japan. It also generates stable recurring income, even during periods of lower vehicle sales.
Emerging technologies and mobility initiatives, including hydrogen fuel cell systems, battery electric vehicles (BEVs), autonomous driving (via Woven by Toyota), and AI-powered mobility platforms, contribute a small but growing portion of revenue, currently estimated at 1.6%. While not yet significant in financial terms, these areas are central to Toyota’s long-term transformation strategy and have seen growing R&D allocation.
Toyota’s heavy investment in R&D, consistently around 8–9% of revenue, supports innovation in electrification, AI, robotics, and autonomous driving. While these initiatives contribute to short-term cost pressure, they are considered essential for maintaining technological leadership and complying with future regulatory standards.
In terms of profitability, Toyota maintains strong gross margins across its core business due to operational efficiency, economies of scale, and its renowned Toyota Production System (TPS). However, newer segments like BEVs and hydrogen mobility currently have higher development and production costs, which modestly impact overall margins as they scale.
Overall, Toyota’s revenue structure reflects both stability and forward-looking diversification. Its core business provides predictable cash flow, while its investments in next-generation mobility position the company for leadership in a rapidly evolving automotive landscape.
Earnings per Share
Illustration 13: Earnings per share for Toyota Motor Corp. from 2009 to 2025
Earnings Per Share (EPS) is a key financial metric that measures a company’s profitability on a per-share basis. It indicates how much profit a company generates for each outstanding share of its stock, and is used to assess a company’s financial health, profitability, and potential for growth. In other words this metric can tell us how profitable the business is.
The EPS figure itself isn’t the primary focus for value investors, it can be 0.2 or 10, but what truly matters is the company’s ability to generate consistent earnings growth. A steadily increasing EPS over time signals strong financial health, profitability, and long-term value creation.
Toyota’s earnings per share from 2009 to 2025 shows an increase over time from -2.88 in 2009 to 23.73 in 2025. This reflects a remarkable turnaround and long-term financial strength, driven by consistent global demand, operational efficiency through the Toyota Production System, and strategic investments in hybrid and next-generation mobility technologies. The steady growth in EPS highlights Toyota’s ability to generate sustainable profits even amid industry disruptions, regulatory changes, and rising R&D spending, positioning it as one of the most resilient and reliable companies in the global automotive sector and is a green flag for investors.
Assets and Liabilities
Illustration 14 and 15: Assets and Liabilities for Toyota from 2009 to 2025
When evaluating a company as a potential investment, understanding its assets and liabilities is crucial. If a local business owner offered to sell their shop to you, one of the first questions. after determining its profitability, would be about its equity and assets. The same principle applies when assessing publicly traded companies like Toyota.
As shown in Illustrations 14 and 15, Toyota has built a substantial asset base, totaling approximately $621 billion in 2024. This steady asset growth from 2009 to 2024 is a strong positive indicator, reflecting the company’s ongoing expansion, long-term investments in electrification, autonomous technology, and manufacturing infrastructure.
At the same time, Toyota’s total liabilities have also increased over the years, rising from approximately $193 billion in 2009 to over $378 billion in 2024. While this rise in liabilities may raise concerns for some investors, it is not necessarily a red flag, as much of it is tied to Toyota’s financial services arm and ongoing investments in electrification, autonomous driving, and next-generation mobility infrastructure. These capital-intensive areas are critical for maintaining Toyota’s global competitiveness and future readiness. Historically, Toyota has maintained a strong balance between investment and financial discipline, supported by robust cash flows and consistent profitability. Nevertheless, the scale of its liabilities warrants continued observation. Investors should monitor Toyota’s ability to manage debt responsibly, ensuring that it does not limit strategic flexibility or affect long-term financial stability as the automotive industry continues to evolve.
The key factor for investors is whether Toyota can effectively manage its debt while maintaining strong revenue and profitability. If the company can generate consistent cash flow and sustain high demand for its products and services, its rising liabilities may not be a major issue. However, if debt levels continue to grow faster than revenue or profits, it could indicate financial strain, making it important for investors to monitor the company’s ability to service its obligations while maintaining profitability.
Toyota’s cash on hand in 2024 is notably less than its long-term debt, which raises some concerns about its liquidity position. Holding less readily available cash compared to its debt obligations may indicate potential challenges in meeting short-term financial commitments without relying on additional financing or asset sales. This imbalance could limit Toyota’s flexibility to fund strategic investments or navigate unexpected market downturns, and investors should monitor the company’s cash flow management closely to assess any risks related to its financial stability. This should be monitored closely by all investors.
As seen in Illustration 15, Total Shareholder Equity, calculated as total assets minus total liabilities, has consistently grown over the past 14 years. This is a positive indicator for potential investors, as it suggests that Toyota is building value over time rather than eroding its financial foundation. A steadily increasing shareholder equity indicates that the company’s assets are growing at a faster rate than its liabilities, which is a green flag for financial health. This trend suggests that Toyota is successfully expanding its operations while maintaining a solid balance sheet. Additionally, rising equity provides a buffer against financial downturns, making the company more resilient in times of economic uncertainty. However, investors should also consider how this growth is achieved, whether through profitable operations or increased debt financing, to fully assess the sustainability of this trend.
Debt to Equity Ratio
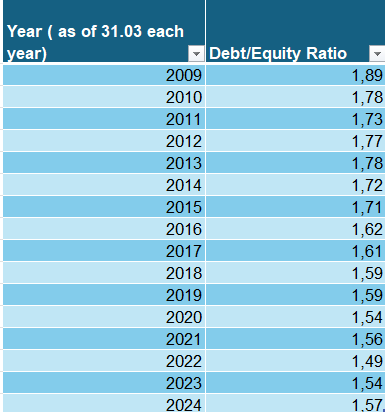
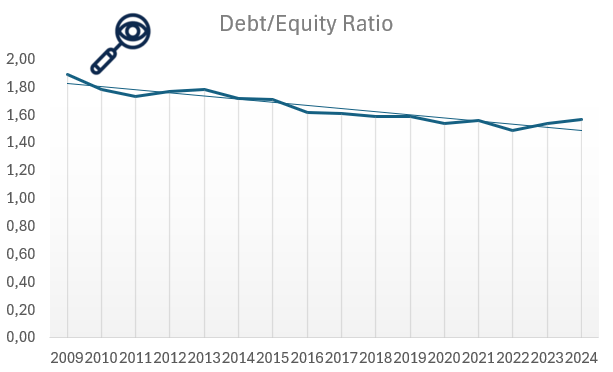
Illustration 16 and 17: Debt to Equity ratio for Toyota Motor Corp. from 2009 to 2024
The Debt-to-Equity (D/E) ratio is an important financial metric for assessing a company’s financial leverage and risk. It compares the amount of debt the company uses to finance its operations relative to its shareholder equity. A high D/E ratio suggests that the company relies more heavily on debt to fuel growth, which could increase financial risk, especially during economic downturns when managing debt obligations becomes more challenging. In contrast, a lower D/E ratio indicates that the company is primarily financed through equity, reducing financial risk but potentially limiting its ability to rapidly expand.
Legendary value investor Warren Buffett generally prefers a debt-to-equity (D/E) ratio below 0.5. Toyota’s D/E ratio, however, stood at approximately 1.57 in 2024. TWhile this could raise concerns about Toyota’s financial leverage and its capacity to manage debt—especially amid industry shifts and economic uncertainties, it is not necessarily a red flag. Toyota has been strategically using debt to fund key investments in electrification, hydrogen technology, and autonomous systems, supporting its long-term growth ambitions. The downwards trend in D/E ratio is also a positive sign for investors as it indicates less reliance on debt financing over the years.
Price to earning ratio (P/E)
Illustration 18 and 19: Price to earnings ratio of Toyota Motor Corp. from 2010 to 2025
For value investors, one of the most critical metrics when evaluating Toyota’s stock is the price-to-earnings (P/E) ratio, as it helps assess whether the company is undervalued or overvalued. Even if a company has strong financials, purchasing its stock at a high price can lead to poor returns. For example, imagine a business generating solid profits of $1 million per year. If the owner offers to sell you the business for just $1, it would be an incredible deal. But if the owner asks for $1 trillion, even though the business is profitable, the price would be absurdly overvalued. The stock market works similarly, companies can be priced cheaply on some days and excessively expensive on others.
Warren Buffett, a legendary value investor, typically considers stocks with a P/E ratio of 15 or lower as “bargains.” A high P/E ratio suggests that investors are paying a premium for the company’s earnings, expecting significant growth. Toyota Motor Corporation has consistently maintained a relatively low P/E ratio over the years, hovering around 10 across multiple periods, as can be seen in illustration 18. This consistent valuation suggests a cautious but stable investor outlook, reflecting Toyota’s mature industry position and steady earnings performance. The current P/E ratio of 10.2 may signal that Toyota remains undervalued relative to the broader market. For value investors, this steady undervaluation could present an appealing entry point, especially if Toyota continues to perform reliably while transitioning to electric and autonomous vehicle technologies.
Price to Book ratio (P/B)
Illustration 20 and 21: Price to book ratio for Toyota Motor Corp. from 2009 to 2024
Price-to-book value (P/B ratio) is a financial metric used to compare a company’s market value (its stock price) to its book value (the net asset value of the company, calculated as total assets minus total liabilities). The P/B ratio is calculated by dividing the current share price by the book value per share. A lower P/B ratio suggests that the stock may be undervalued, as investors are paying less for the company’s assets than their actual worth. Conversely, a high P/B ratiomay indicate that the stock is overvalued, or that investors expect high growth in the company’s future earnings. The P/B ratio is often used by value investors to assess whether a stock is trading at a fair price based on its underlying assets. Legendary Investor Warren Buffet prefers company’s with P/B lower than 1.5 and often buys around 1.3 or lower.
The price-to-book (P/B) ratio of Toyota Motor Corporation is a green flag for value-oriented investors, as it has remained consistently low compared to industry peers and well within the range Warren Buffett often considers attractive. With a P/B ratio typically hovering around 1.0 or lower in recent years, Toyota appears undervalued relative to the net worth of its assets. This suggests that investors are paying a modest price for ownership in a company with strong tangible asset backing, healthy cash flows, and a proven global presence. Unlike tech companies with inflated P/B ratios driven by future growth speculation, Toyota’s low P/B reflects its stable earnings, conservative balance sheet, and disciplined capital allocation. For value investors, this consistency signals a potentially underappreciated opportunity, especially as Toyota ramps up its transition to electric and hydrogen vehicles, which could unlock new growth while maintaining financial resilience. Rather than indicating market pessimism, Toyota’s low valuation may simply reflect a longstanding investor tendency to undervalue traditional automakers, offering a chance for upside if the market re-rates its future prospects.
Return on Investment (ROI)
Illustration 22 and 23: Return on Investment for Toyota Motor Corp. from 2010 to 2015
For value investors, another essential metric when evaluating Toyota’s stock is Return on Investment (ROI), as it reveals how efficiently the company is using its capital to generate profits. In simple terms, ROI measures how much return a business earns relative to the capital invested to run it. Even if a company shows strong revenues, if it needs massive amounts of capital to produce modest profits, it may not be an attractive investment. For example, if one company generates a $100,000 return on a $1 million investment, while another earns the same return on just $500,000, the latter is clearly more efficient and potentially more valuable. ROI helps investors identify these distinctions and avoid companies that consume capital without delivering proportional returns. The higher the ROI, the better but it is also very industry dependent as some industries need a lot more capital than others. Legendary investor Warren Buffett has often stated that he seeks returns of at least 15% annually on his investments over time. While he doesn’t quote ROI specifically, this is effectively what he aims for in terms of return on invested capital and intrinsic value growth.
Toyota Motor Corporation has historically delivered a low but stable ROI, often ranging between 5% and 10%, which is considered healthy for a capital-intensive industry like automotive manufacturing. Even though, this is under Buffet’s expectations this is a normal ROI in the automaker industry which is very capital intensive. This consistent performance indicates that Toyota is effectively deploying its resources to generate returns, especially in comparison to peers in the same sector who may struggle with slimmer margins or capital inefficiency. As shown in illustration 21, Toyota’s ability to maintain solid ROI over time. despite economic cycles, supply chain disruptions, and shifts in consumer demand, demonstrates sound management and operational resilience. For long-term investors, this level of capital efficiency is a green flag, suggesting that Toyota is not just a stable company but one that continues to deliver meaningful returns without reckless spending, even as it invests in the future of mobility through electrification and automation.
Dividend
Illustration 24: Dividend Yield and dividend payout ratio from 2005 to 2025.
Toyota Motor Corporation has established itself as a reliable dividend payer in the global automotive industry, offering an annual dividend of approximately ¥60–¥70 per share in recent years. This reflects the company’s commitment to rewarding shareholders while maintaining financial discipline. Toyota’s steady dividend history—even through economic downturns—underscores its reputation as a financially stable, conservative company, making it a favorable choice for income-seeking investors.
However, there are considerations regarding Toyota’s dividend yield, which typically ranges between 2% and 3%. While the company continues to return capital to shareholders, growing demands for investment in electrification, autonomous driving, and sustainability initiatives could limit the pace of future dividend increases. As Toyota ramps up R&D and capital expenditures to stay competitive in a rapidly evolving industry, sustained dividend growth may face some headwinds if earnings growth slows.
Insider Trading
As a Foreign Private Issuer (FPI), Toyota is not required to file insider trading reports with the U.S. Securities and Exchange Commission (SEC). However, the company provides detailed disclosures in its annual reports and Form 20-F filings, which include information on executive compensation, shareholdings, and related party transactions.
Over the past years, Toyota Motor Corporation has not reported direct insider transactions involving its own shares. According to publicly available data and insider-tracking sources, the most recent direct insider transactions involving Toyota Motor Corporation’s own stock (NYSE: TM) date back to 2004.
This can be seen as both a red and a green flag for potential investors. It is a green flag as The absence of insider sales may suggest that Toyota’s executives have long-term confidence in the company and see no reason to cash out. Unlike many public firms where executives frequently sell stock, Toyota’s leadership appears more focused on stewardship than on short-term financial gains. Furthermore, In Japan, corporate culture traditionally emphasizes stability, loyalty, and modest compensation. Executives are less incentivized through stock grants compared to U.S. firms. This can reflect a conservative, shareholder-friendly philosophy where management is aligned with long-term success rather than short-term speculation.
However, The absence of insider purchases—even during market dips—may raise eyebrows. If executives truly believed the stock was undervalued at any point, why didn’t they buy? In the U.S., insider buying is often considered a strong bullish signal. Toyota is a Japanese company listed as an ADR (American Depositary Receipt) in the U.S., and insider trading disclosures aren’t held to the same real-time standards as in the U.S. This can lead to lower visibility and slower access to critical insider activity data, which some investors view as a governance downside. Toyota’s executive compensation is less tied to equity than U.S. firms, meaning insiders may not have “skin in the game” to the same extent. For some investors, this reduces alignment between management and shareholders.
Other Company Info
Founded in 1937, Toyota Motor Corporation is one of the world’s largest and most respected automotive manufacturers, known for its high quality and sustainable vehicles. As of 2024, Toyota employs approximately 375,000 people globally, reflecting its extensive operations in manufacturing, R&D, and mobility solutions. The company is publicly traded on the Tokyo Stock Exchange (TSE) under the ticker symbol 7203 which is its main listing, but it is also cross -listed on the New York Stock Exchange under the ticker symbol TM and operates within the Consumer Discretionary sector, specifically in the Automobiles industry.
Toyota is headquartered at 1 Toyota-cho, Toyota City, Aichi Prefecture, Japan. As of 2024, the company has approximately 3.2 billion shares outstanding, with a market capitalization of over $300 billion USD. For more information, visit Toyota’s official website: https://global.toyota.
Final Verdict
Toyota Motor Corporation is a solid long-term investment, especially for value and income investors. With consistently low P/E and P/B ratios, the stock appears undervalued compared to its history and peers. Toyota has a strong balance sheet, steady dividends, and a conservative payout ratio, making it reliable for income seekers.
The company is investing in hybrids, electric vehicles, hydrogen fuel cells, and autonomous driving, maintaining its global leadership with operations in over 170 countries. Although Toyota’s EV transition is slower than some competitors, its diversified approach could offer stability.
Overall, Toyota looks like a great opportunity for value investors. It seems undervalued, has solid financials and offers steady growth nad reliable dividends, making it an attractive choice for long-term investors focused on stability rather than rapid growth.
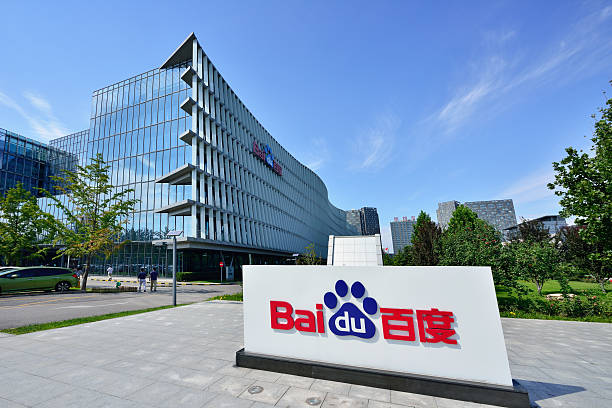
Baidu Inc. is a prominent Chinese multinational technology company, widely recognized as one of the world’s leading artificial intelligence (AI) and internet services providers. Headquartered in Beijing, Baidu is best known for operating China’s largest search engine, but its portfolio spans a broad range of sectors, including cloud computing, autonomous driving, language processing, and smart devices.
Illustration 1: The Baidu logo, featuring its distinctive pawprint symbol, representing its digital footprint and innovation.
Unlike many global tech giants that emerged from the West, Baidu has played a foundational role in shaping the Chinese internet landscape. Its search engine dominates the domestic market, while its ongoing investment in AI and machine learning has positioned the company as a key innovator in emerging technologies such as autonomous vehicles and natural language understanding.
As a member of China’s “BAT” trio (Baidu, Alibaba, Tencent), Baidu is one of the most influential tech companies in Asia. Its technological infrastructure powers a wide array of services, including Baidu Maps, Baidu Cloud, and DuerOS—a voice assistant platform integrated into various smart devices. With a strong focus on AI research, a deep data ecosystem, and strategic partnerships, Baidu continues to be a driving force in the global tech landscape, particularly in AI and intelligent mobility.
History
Baidu was founded in 2000 by Robin Li and Eric Xu, emerging at a time when China’s internet ecosystem was still in its infancy. Robin Li’s development of the RankDex site-scoring algorithm in the late 1990s laid the foundation for Baidu’s core search technology—a precursor to modern search engine optimization and ranking systems.
Baidu’s breakthrough came in the early 2000s as it rapidly became China’s dominant search engine, offering results tailored to Chinese-language users with superior indexing of Chinese websites. The company’s innovative pay-for-placement advertising model helped generate significant early revenue, setting the stage for rapid growth and public listing on the NASDAQ in 2005.
Throughout the 2010s, Baidu evolved from a search engine company into a diversified tech powerhouse. It expanded into cloud services, digital maps, mobile applications, and AI-powered products. A major turning point was its strategic pivot toward artificial intelligence—investing heavily in autonomous driving (Apollo), smart voice assistants (DuerOS), and deep learning platforms (PaddlePaddle), making AI central to its long-term vision.
By the 2020s, Baidu had positioned itself as a global leader in AI and autonomous technology. Its Apollo platform became one of the most advanced autonomous driving systems in the world, and Baidu began operating robotaxi services in several Chinese cities. The company also deepened its AI capabilities through Baidu Brain, a large-scale AI system integrating vision, speech, knowledge, and language technologies.
Today, Baidu remains one of China’s most influential technology companies. With a strong emphasis on innovation, research, and ethical AI development, Baidu continues to drive advancements across industries. In the stock market, Baidu is seen as a bellwether for the Chinese tech sector, reflecting broader trends in AI, cloud computing, and digital infrastructure.
Operations and Products
Search, Cloud, and AI-Driven Ecosystem
Baidu operates one of the world’s largest and most advanced AI-powered ecosystems, built on a foundation of search, cloud computing, and intelligent services. While the company began as China’s premier internet search engine, it has transformed into a diversified technology enterprise focused on artificial intelligence, autonomous driving, cloud services, and smart devices.
Baidu’s core products still include its flagship Baidu Search, which dominates the Chinese-language internet search market. Over time, this platform has evolved with advanced AI features such as voice search, natural language processing (NLP), and personalized results based on big data analytics.
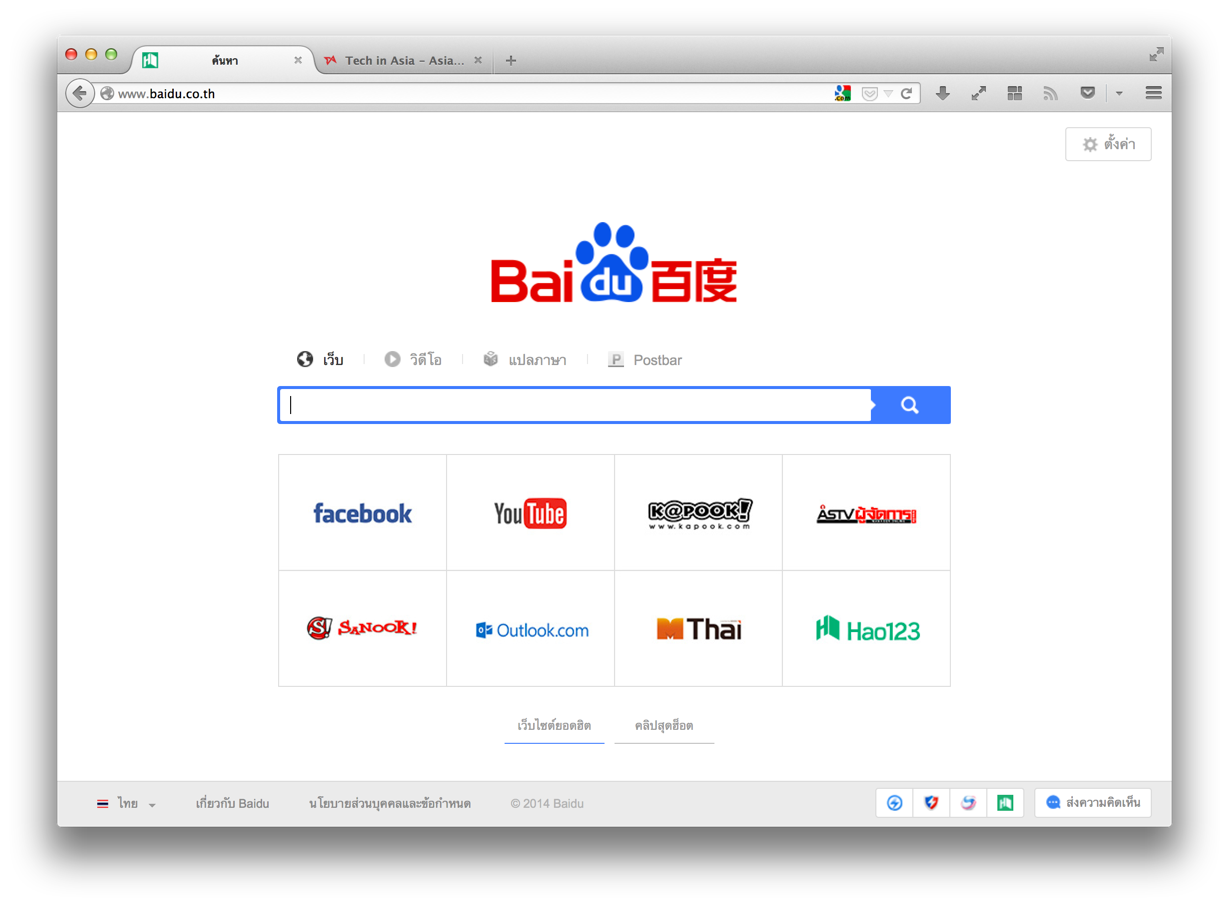
Illustration 2: Baidu Search is the product Baidu is most famous for.
Beyond search, Baidu Cloud delivers enterprise-grade infrastructure and intelligent services, including AI-powered data analytics, intelligent speech and image recognition, and machine learning platforms. This cloud ecosystem serves sectors like finance, healthcare, manufacturing, and smart cities.
Autonomous Driving and Smart Transportation
One of Baidu’s most prominent innovations is Apollo, its open-source autonomous driving platform. Apollo provides a comprehensive solution for autonomous vehicle development, including software stacks, cloud-based simulation tools, and in-vehicle operating systems. The platform is used by global automakers and has powered the launch of robotaxi services in cities like Beijing, Wuhan, and Chongqing.
Illustration 3: One of Baidu’s Apollo robotaxies
In addition to Apollo, Baidu has introduced RT6, a fully autonomous electric vehicle designed for urban ride-hailing, marking a step forward in reducing operational costs and scaling autonomous mobility.
Voice Assistants and Smart Devices
Baidu’s AI assistant DuerOS powers a growing range of smart devices, from smart speakers and in-car infotainment systems to household appliances. Through natural language processing and conversational AI, DuerOS enables hands-free interaction and integration with Baidu’s services.
The company has also developed AI chips, such as Kunlun, to support high-performance AI processing for applications in data centers and on edge devices. These chips are used for deep learning, image and speech recognition, and autonomous driving computation.
Emerging Technologies and Future Focus
Baidu is investing heavily in generative AI, foundation models, and language-based applications. Its ERNIE (Enhanced Representation through Knowledge Integration) model is China’s counterpart to GPT-like large language models, enabling everything from AI writing and coding to intelligent customer service and enterprise automation.
Looking ahead, Baidu is positioning itself as a global AI leader, with a focus on AI cloud integration, smart transportation infrastructure, and intelligent edge computing. Its commitment to ethical AI, energy efficiency, and open-source collaboration ensures its relevance in both China’s tech ecosystem and the broader international market.
Key Competitors
Baidu operates in several fast-evolving and highly competitive sectors, including internet services, artificial intelligence, cloud computing, and autonomous driving. Its major competitors vary by product category and technological focus:
Alibaba Group – As one of China’s largest tech conglomerates, Alibaba competes with Baidu primarily in cloud computing and AI services. Alibaba Cloud is a top rival to Baidu Cloud, offering a wide range of infrastructure and machine learning tools to enterprise clients. Alibaba also invests heavily in smart city and AI-driven business applications.
Tencent – Known for WeChat and its expansive digital ecosystem, Tencent competes with Baidu in the realms of online advertising, content distribution, and AI-powered applications. Tencent’s investments in cloud computing, search, and smart services overlap with Baidu’s broader AI ecosystem.
ByteDance – While originally known for its short-form video platforms like TikTok (Douyin in China), ByteDance has become a formidable competitor in AI and online search. Its Toutiao news aggregation platform and growing ambitions in AI research present a challenge to Baidu’s dominance in content discovery and recommendation systems.
Huawei – Huawei competes with Baidu in AI chips, cloud services, and smart infrastructure. The company’s Ascend AI processors and Huawei Cloud offerings rival Baidu’s Kunlun chips and cloud-based AI solutions. Huawei is also a major player in intelligent transportation, overlapping with Baidu’s Apollo platform.
Illustration 4: Baidu Headquarters in Beijing China
Google (Alphabet Inc.) – On the international stage, Google is Baidu’s most direct analogue, especially in search, cloud, and AI research. While Google does not operate in mainland China due to regulatory constraints, both companies compete globally in areas such as large language models, autonomous driving, and AI-powered cloud services.
Competitive Advantage
Baidu’s most significant competitive advantage lies in its deep expertise and long-standing investment in artificial intelligence (AI). As one of the first Chinese tech companies to prioritize AI as a core strategy, Baidu has built a vertically integrated AI ecosystem that spans foundational research, infrastructure, and practical applications. Its proprietary ERNIE large language model and AI framework PaddlePaddle give Baidu full-stack control over its AI pipeline, from model training to deployment—similar to how a vertically integrated chipmaker controls the semiconductor process. This in-house AI capability enables Baidu to quickly adapt and deploy solutions across sectors such as search, cloud computing, autonomous driving, and smart devices, giving it a strong edge over companies that rely on third-party models or external development frameworks.
Another competitive strength is Baidu’s autonomous driving platform, Apollo, which is widely regarded as one of the world’s most advanced open-source ecosystems for intelligent mobility. With partnerships across the automotive industry and active robotaxi deployments in multiple Chinese cities, Baidu has a first-mover advantage in the smart transportation space.
Baidu also benefits from its dominance in Chinese-language search and knowledge-based services. Its search engine remains the market leader in China, supported by AI-enhanced features and deep content integration through platforms like Baidu Baike (an online encyclopedia) and Baidu Tieba (a discussion forum network). These platforms give Baidu access to vast amounts of first-party data, enabling superior personalization, ad targeting, and machine learning performance.
Additionally, Baidu’s emphasis on data security, localization, and regulatory alignment gives it an operational advantage in China’s tightly regulated digital environment. The company’s strong government relations and commitment to compliance enable it to operate at scale in areas where foreign tech giants face barriers.
Finally, Baidu’s strong R&D culture, with continuous investment in AI chips (e.g., Kunlun) and next-gen computing, ensures its long-term competitiveness. Combined with a robust cloud infrastructure, a growing enterprise customer base, and integrated smart services, Baidu is uniquely positioned to lead China’s digital transformation and compete globally in AI-driven technologies.
Illustration 5: A Baidu AI robot
Future Outlook
Baidu is expected to see steady growth as demand rises for smart mobility, cloud services, and intelligent digital tools in China. Sectors like autonomous driving, enterprise cloud solutions, and digital infrastructure are projected to expand, creating new opportunities for the company.
With ongoing investment in self-driving technology (Apollo), custom chips (Kunlun), and industry-focused cloud services, Baidu is well-placed to benefit from China’s push toward automation and digitalization. As these trends continue, demand for Baidu’s core services is likely to increase in the years ahead.
Stock Analysis
In this section we will analyze Baidu’s stock to see if it is a good stock to buy or not. Our philosophy is value investing meaning that we try to find good quality companies that are undervalued. However, we will give a holistic overview so all kind of investors with different philosophies can judge the stock for themselves.
Revenueand Profits
Illustration 6 and 7: Revenue of Baidu from 2009 to 2024
As shown in Illustration 6 and 7, Baidu has experienced a dynamic long-term revenue trajectory, particularly from 2009 to 2021, when it established itself as China’s dominant search engine and a major player in online advertising. The company’s early lead in China’s digital economy, supported by rapid internet adoption and growing advertiser demand, helped drive consistent gains throughout much of this period. Baidu also began investing in emerging technologies during these years, including artificial intelligence, autonomous driving, and cloud services, laying the groundwork for future diversification.
However, despite these early advantages, Baidu encountered periods of slower growth and revenue pressure, notably between 2021 and 2024. This downturn was driven by intensifying competition from platforms like Tencent and Bytedance, shifts in user behavior toward mobile super apps and short-form video, and internal restructuring. In response, Baidu expanded its R&D spending and began repositioning itself as a technology-driven company beyond search, focusing on AI cloud computing, Apollo (autonomous driving), and smart devices. The role of coid-19 on the very strong revenue increase is also worth taking in to consideration.
Baidu’s revenue is overall a green flag as it shows a steady increase in income over time and also reflects the company’s ability to adapt through diversification into AI, cloud, and autonomous driving, positioning it well for future growth despite short-term volatility.
Illustration 8 and 9: Net Income for Baidu from 2009 to 2024
Net income is a crucial metric to evaluate when determining whether a company is a worthwhile investment. It represents a company’s net profit or loss after accounting for all revenues, income items, and expenses, calculated as Net Income = Revenue – Expenses.
As can be seen from Illustration 8 and 9, the net income for Baidu rose steadily from 2009 to 2015 due to strong performance in its core search and online advertising business. However, from 2015 to 2025, net income has been highly volatile despite steadily increasing revenue. This disconnect is largely due to rising operating costs, heavy R&D investments in AI, autonomous driving, and cloud services, as well as regulatory headwinds and economic uncertainty in China. While revenue growth indicates strong top-line performance, the inconsistency in net income is a red flag, suggesting pressure on margins and highlighting the financial risks tied to Baidu’s aggressive long-term innovation strategy.
Revenue Breakdown
Illustration 10: Revenue Breakdown for Baidu gathered from gurufocus
The Online Marketing segment is Baidu’s largest revenue driver, contributing approximately 60–70% of total revenue. This segment primarily consists of pay-per-click (PPC) advertising services through Baidu’s core search engine platform, as well as display ads across its ecosystem of products and content partners. Despite growing competition from platforms like Tencent and ByteDance, Baidu maintains a strong presence in China’s search-based ad market. However, ad revenue has faced pressure in recent years due to regulatory crackdowns on internet companies, weakening macroeconomic conditions, and advertisers shifting budgets toward e-commerce and short video platforms.
Baidu’s non-advertising revenue—mainly from AI Cloud and intelligent driving—now accounts for approximately 25–30% of total revenue. This segment includes Baidu AI Cloud services, Apollo autonomous driving, Xiaodu smart devices, and intelligent transportation systems. AI Cloud has seen significant growth from government and enterprise demand for digital transformation, while Apollo remains a long-term bet on the future of mobility. These areas have required heavy investment and contributed to margin pressure, but they represent key pillars of Baidu’s strategic pivot beyond advertising. The cloud segment, in particular, has shown strong momentum, with revenue growing over 20% year-over-year in several recent quarters.
The remaining 5–10% of Baidu’s revenue comes from other sources, including content subscriptions, licensing, and miscellaneous services tied to the company’s broader AI ecosystem. While not core drivers of growth, these smaller streams add diversification and support Baidu’s broader goal of becoming a comprehensive AI and technology platform.
Despite this diversification, Baidu has faced financial pressure in recent years. While revenue has continued to rise, net income has been volatile due to high R&D costs, regulatory expenses, and ongoing losses in emerging business units like autonomous driving. For example, Baidu’s net income dropped from RMB 10.2 billion in 2021 to RMB 7.6 billion in 2023, with fluctuations expected to continue as the company scales its next-gen technologies.
As seen in Illustration 13, a significant portion of Baidu’s revenue is allocated to cost of goods sold (COGS), particularly within its cloud and AI-related businesses. Unlike the higher-margin search advertising segment, Baidu’s non-advertising services—such as AI Cloud and smart devices—tend to carry higher operational costs, resulting in a larger share of revenue consumed by COGS. This has put pressure on overall gross margins, especially as these segments expand. Additionally, Baidu consistently allocates over 15% of its revenue to research and development (R&D), reflecting its strategic focus on long-term innovation in AI and autonomous technologies. While these investments are vital for future growth, they contribute to current margin compression and earnings volatility.
Overall, Baidu’s revenue breakdown reflects both stability and transformation. Its dominance in online advertising ensures steady cash flow, while emerging segments in AI and autonomous driving offer promising growth opportunities. However, investors should be aware of the execution risks and earnings volatility that come with this strategic shift.
Earnings per Share (EPS)
Illustration 11: Earnings per share for Baidu from 2009 to 2024
Earnings Per Share (EPS) is a key financial metric that measures a company’s profitability on a per-share basis. It indicates how much profit a company generates for each outstanding share of its stock, and is used to assess a company’s financial health, profitability, and potential for growth. In other words this metric can tell us how profitable the business is.
The EPS figure itself isn’t the primary focus for value investors—it can be 0.2 or 10, but what truly matters is the company’s ability to generate consistent earnings growth. A steadily increasing EPS over time signals strong financial health, profitability, and long-term value creation.
Baidu’ earnings per share (EPS) performance from 2009 to 2015 reflects a generally strong long-term trend, but recent years have shown a concerning volatility as shown in illustration 11. From 2009 to 2015, Baidy consistently grew its EPS, reaching a peak of $16.69 per share in 2015. However, from 2015 onwards, Baidu’s EPS has shown pronounced fluctuations. This volatility has been driven by several factors: intensifying competition from other tech giants, heavy investments in AI and autonomous driving, regulatory pressures within China’s tech sector, and broader macroeconomic uncertainties. While there were periods of recovery and innovation-led growth, the company has struggled to maintain stable profit expansion year-over-year.
This volatility is a red flag for investors, as it indicates that Baidu is struggling to maintain steady profit growth despite its historically strong revenue performance. However, in recent years from 2022 its EPS has been steadily increasing which is a positive sign and shows an ability to grow a profit. Potential Investors should in all case monitor the EPS of Baidu closely for sudden changes.
Assets and Liabilities
Illustration 12 and 13: Assets and Liabilities for Baidu from 2009 to 2024.
When evaluating a company as a potential investment, understanding its assets and liabilities is crucial. If a local business owner offered to sell their shop to you, one of the first questions—after determining its profitability—would be about its equity and assets. The same principle applies when assessing publicly traded companies like Baidu.’
As shown in Illustrations 11 and 12, Texas Instruments has a substantial asset base, totaling $58.6 billion in 2024. This steady asset growth over time from 2009 to 2024 is a positive sign, indicating that the company is expanding its operations, investing in new technologies, and strengthening its market position. A growing asset base often reflects a company’s ability to scale its business, acquire new projects, and improve its production capacity, which is particularly important in the competitive industry Baidu is in.
At the same time, Baidu’s total liabilities have also increased significantly, rising from $0.2 billion in 2009 to $21.1 billion in 2024. While such a sharp rise in debt might raise concerns for some investors, it is not necessarily a red flag given Baidu’s ongoing investments in artificial intelligence, cloud computing, and autonomous driving. These capital-intensive initiatives are essential for maintaining technological leadership in a rapidly evolving landscape. Baidu has historically balanced its investments with a strong focus on innovation and long-term growth, but the rising debt levels warrant careful observation. Investors should closely monitor Baidu’s ability to manage its liabilities effectively, especially amid recent earnings volatility. Ensuring that debt remains manageable and does not hinder future financial stability will be crucial for the company’s long-term success.
The key factor for investors is whether Baidu can effectively manage its debt while maintaining strong revenue and profitability. If the company can generate consistent cash flow and sustain high demand for its products and services, its rising liabilities may not be a major issue. However, if debt levels continue to grow faster than revenue or profits, it could indicate financial strain, making it important for investors to monitor the company’s ability to service its obligations while maintaining profitability.
The cash on hand for Baidu is a green flag for potential investors, as the company has $19 billion in readily available cash as of 2024. This is significantly higher than its long-term debt of $7.1 billion, which indicates a strong liquidity position. This suggests that Baidu is well-equipped to meet its financial obligations, fund strategic investments, and weather short-term market uncertainties without relying heavily on external financing.
As seen in Illustration 13, Total Shareholder Equity—calculated as total assets minus total liabilities—has consistently grown over the past 14 years. This is a positive indicator for potential investors, as it suggests that Baidu is building value over time rather than eroding its financial foundation. A steadily increasing shareholder equity indicates that the company’s assets are growing at a faster rate than its liabilities, which is a green flag for financial health. This trend suggests that Baidu is successfully expanding its operations while maintaining a solid balance sheet. Additionally, rising equity provides a buffer against financial downturns, making the company more resilient in times of economic uncertainty. However, investors should also consider how this growth is achieved—whether through profitable operations or increased debt financing—to fully assess the sustainability of this trend.
Debt to Equity Ratio
Illustration 14 and 15: Debt tp Equity ratio of Baidu from 2009 to 2024
The Debt-to-Equity (D/E) ratio is an important financial metric for assessing a company’s financial leverage and risk. It compares the amount of debt the company uses to finance its operations relative to its shareholder equity. A high D/E ratio suggests that the company relies more heavily on debt to fuel growth, which could increase financial risk, especially during economic downturns when managing debt obligations becomes more challenging. In contrast, a lower D/E ratio indicates that the company is primarily financed through equity, reducing financial risk but potentially limiting its ability to rapidly expand.
Legendary value investor Warren Buffett generally prefers a ratio below 0.5. Baidu’s D/E ratio is currently above that, standing at approximately 0.61 as of 2024 which is not much especially considering all the new AI projects Baidu has started in recent years. The D/E has steadily increased from 2009 where it was just 0.25. This indicates a growing reliance on debt financing over the past decade. This rising trend could raise concerns about Baidu’s financial leverage and its ability to manage debt effectively, especially in a volatile regulatory and competitive environment. However, this is not necessarily a red flag as Baidu has been investing in more AI projects during this time span that are financed through debt financing.
Since peaking around 2018, Baidu’s D/E ratio has shown signs of moderation, indicating a possible shift toward a more balanced capital structure. This decline may reflect efforts to deleverage and improve financial stability, which could be appealing to long-term investors focused on risk management. Baidu’s D/E ratio has also shown some volatility, suggesting that while the company generally maintains a cautious approach to debt, there are periods where leverage increases—potentially due to large-scale investments in AI, cloud, and autonomous driving. This isn’t necessarily a red flag, as long as Baidu avoids becoming overly dependent on debt. Still, the combination of rising debt and inconsistent profitability should be monitored closely, as it could pose risks to financial flexibility if not managed prudently.
Price to earnings ratio (P/E)
Illustration 16 and 17: P/E ratio of Baidu from 2010 to 2024
For value investors, one of the most critical metrics when evaluating Baidu’s stock is the price-to-earnings (P/E) ratio, as it helps assess whether the company is undervalued or overvalued. Even if a company has strong financials, purchasing its stock at a high price can lead to poor returns. For example, imagine a business generating solid profits of $1 million per year. If the owner offers to sell you the business for just $1, it would be an incredible deal. But if the owner asks for $1 trillion, even though the business is profitable, the price would be absurdly overvalued. The stock market works similarly—companies can be priced cheaply on some days and excessively expensive on others.
Warren Buffett, a legendary value investor, typically considers stocks with a P/E ratio of 15 or lower as “bargains.” A high P/E ratio suggests that investors are paying a premium for the company’s earnings, expecting significant growth. The P/E ratio of Baidu has fluctuated widely, ranging from 79.6 in 2010, to 19.21 in 2019, spiking to 99.79 in 2020, and dropping significantly to 12.5 in 2025. These sharp fluctuations are a red flag for potential investors, as they indicate market uncertainty and inconsistent investor confidence in Baidu’s earnings potential. However, the current P/E ratio of 12.5 suggests that Baidu may be undervalued, especially when compared to its historical valuation levels. For value investors, this could represent a potential buying opportunity—provided that the company can stabilize earnings and deliver on future growth prospects.
Price to book value (P/B ratio)
Illustration 18 and 19: Price to book ratio of Baidu from 2010 to 2025.
Price-to-book value (P/B ratio) is a financial metric used to compare a company’s market value (its stock price) to its book value (the net asset value of the company, calculated as total assets minus total liabilities). The P/B ratio is calculated by dividing the current share price by the book value per share. A lower P/B ratio suggests that the stock may be undervalued, as investors are paying less for the company’s assets than their actual worth. Conversely, a high P/B ratiomay indicate that the stock is overvalued, or that investors expect high growth in the company’s future earnings. The P/B ratio is often used by value investors to assess whether a stock is trading at a fair price based on its underlying assets. Legendary Investor Warren Buffet prefers company’s with P/B lower than 1.5 and often buys around 1.3 or lower.
The price-to-book (P/B) ratio of Baidu is a green flag, as it is significantly lower than that of many competitors in the tech sector and falls below the levels Warren Buffett typically considers undervalued. This suggests that the company may be undervalued relative to its book value, meaning investors are paying less for its assets compared to peers. Furthermore, the overall downward trend in Baidu’s P/B ratio in recent years indicates weakening investor sentiment, even as revenues have continued to grow. This could reflect under-optimism about Baidu’s future growth or a disconnect between its stock price and its underlying fundamentals. If profitability continues to decline while the P/B ratio remains low, it could signal a risk of value traps—where a stock appears cheap but lacks the catalyst for recovery. Investors should carefully assess whether the company’s financial performance can support future growth or if the current low valuation reflects deeper structural concerns.
Dividend
As of 2025, Baidu does not pay a regular dividend to shareholders. Baidu has historically reinvested its earnings into research and development, artificial intelligence, autonomous driving, and other growth initiatives rather than returning capital to shareholders through dividends. This strategy is typical for many tech companies, especially those still focused on expansion and innovation. If you’re looking for dividend-paying Chinese tech companies, you might want to look at others like Tencent or Alibaba, which have initiated or considered dividend payments in recent years.
Insider Trading
Over the past few years, insider trading activity at Baidu has been relatively limited, which is generally a neutral to green flag for investors, as it suggests stability and confidence in the company’s long-term prospects. However, there have been some notable planned transactions. For instance, in October 2024, insider Melissa Dongmin Ma filed a Form 144 to sell approximately 395,000 shares valued at around $41.6 million, following a similar filing in July 2024 for 260,000 shares worth about $22.4 million. While such large proposed sales might raise eyebrows, they are not necessarily a red flag, especially if they are part of routine portfolio diversification or personal financial planning. The absence of widespread or frequent insider selling supports a cautiously positive view, but investors should still monitor any emerging trends that may reflect shifting internal sentiment.
Other Company Info
Founded in 2000, Baidu Inc. is a leading Chinese technology company specializing in internet-related services, artificial intelligence, and autonomous driving technologies. As of 2024, Baidu employs approximately 35,900 people, reflecting its continued investment in research and development across AI, cloud computing, and smart mobility. The company is publicly traded on the NASDAQ under the ticker symbol BIDU and operates within the Technology sector, specifically under the Interactive Media & Services industry.
Baidu is headquartered at No. 10 Shangdi 10th Street, Haidian District, Beijing, China. As of 2024, the company has approximately 348 million shares outstanding, with a market capitalization of around $45 billion USD. For more information, visit Baidu’s official website: https://www.baidu.com.
Illustration 20-22: Number of employees and location of Baidu Headquarters in Beijing China
Final Verdict
Investing in Baidu Inc. presents a compelling opportunity, particularly for investors seeking exposure to China’s AI and digital innovation sectors. As a pioneer in search engine technology and artificial intelligence, Baidu has positioned itself at the forefront of China’s tech evolution, with major investments in autonomous driving (Apollo), AI cloud services, and generative AI models. The company’s strong research capabilities and diversified revenue streams—from online marketing to cloud and AI solutions—underscore its long-term growth potential.
However, investors should approach with measured caution. Baidu’s earnings have shown significant volatility in recent years, and while its P/E ratio is currently low (around 12.5 as of April 2025)—suggesting undervaluation—this reflects muted investor sentiment amid regulatory uncertainty and inconsistent profitability. Additionally, Baidu does not currently pay a dividend, which may deter income-focused investors. Competition from domestic tech giants like Alibaba, Tencent, and ByteDance also remains a persistent challenge.
Overall, Baidu may be a suitable investment for long-term, growth-oriented investors who are comfortable with short-term volatility and regulatory risk in exchange for potential upside tied to China’s AI-driven future. However, Its Net Income should be monitored closely.
Texas Instruments (TI) is a globally recognized American technology company specializing in the design and manufacturing of analog and embedded semiconductor solutions. Headquartered in Dallas, Texas, TI plays a crucial role in various industries, from consumer electronics to automotive, industrial automation, and communications. Unlike companies that focus primarily on digital processors, TI is a dominant force in the analog semiconductor market, producing essential components that enable power management, signal processing, and wireless connectivity.
Illustration 1: The logo of Texas Instruments which includes its famous outline of the state of Texas.
As one of the largest semiconductor manufacturers by revenue, Texas Instruments has maintained a strong market presence for decades. The company’s extensive product portfolio includes microcontrollers, power management chips, and data converters, which are integral to countless electronic devices. TI’s robust financial performance, strategic innovation, and commitment to efficient manufacturing make it a key player in the semiconductor industry.
History
Texas Instruments traces its origins back to 1930 when it was founded as Geophysical Service Incorporated (GSI), a company specializing in oil exploration technology. In 1951, it rebranded as Texas Instruments and shifted its focus to the emerging semiconductor industry.
TI’s breakthrough moment came in 1958 when engineer Jack Kilby invented the integrated circuit (IC), revolutionizing electronics and laying the foundation for modern computing. This innovation earned Kilby the Nobel Prize in Physics and cemented TI’s reputation as a semiconductor pioneer.
Throughout the 20th century, Texas Instruments played a pivotal role in advancing semiconductor technology. It became a leader in analog and embedded processing, developing industry-leading signal processors, power management chips, and automotive electronics. The company also ventured into consumer electronics, famously producing the first handheld calculator and early digital signal processors (DSPs).
By the 2000s, TI had streamlined its operations, focusing primarily on analog and embedded processing. This strategic move allowed the company to strengthen its competitive advantage in power-efficient, high-performance semiconductor solutions. Today, Texas Instruments continues to lead the analog semiconductor market, benefiting from its broad customer base, efficient manufacturing processes, and long product life cycles.
With a commitment to innovation and sustainability, TI invests heavily in research and development while expanding its global production capabilities. As industries increasingly rely on analog and embedded technologies, Texas Instruments remains well-positioned to drive growth and maintain its leadership in the semiconductor sector. In the stock market, Texas Instruments is often regarded as an indicator for the semiconductor and electronics industry as a whole, since the company sells to more than 100,000 customers.
Operations and Products
Analog and Embedded Semiconductor Manufacturing
Texas Instruments (TI) is one of the world’s leading manufacturers of analog and embedded semiconductors, supplying essential components for industries such as automotive, industrial automation, consumer electronics, and communications. Unlike digital-focused semiconductor companies, TI specializes in analog chips and embedded processors that enable power management, signal processing, and wireless connectivity in electronic devices.
TI’s product portfolio includes power management integrated circuits (PMICs), data converters, amplifiers, sensors, and embedded processors like microcontrollers (MCUs) and digital signal processors (DSPs). These chips are fundamental to applications ranging from electric vehicles and renewable energy systems to medical devices and industrial automation.
A key differentiator for Texas Instruments is its in-house semiconductor manufacturing. The company operates its own wafer fabrication facilities (fabs), allowing greater control over production costs, quality, and supply chain stability. TI has invested heavily in advanced manufacturing processes, including the expansion of its 300mm wafer fabs, which provide significant cost advantages compared to traditional 200mm fabs.
Emerging Technologies and Future Growth Areas
Texas Instruments is strategically expanding its capabilities in several high-growth markets, particularly in automotive and industrial sectors. The increasing adoption of electric vehicles (EVs) and autonomous driving has driven demand for TI’s power management and sensing technologies, making it a critical supplier for automakers and Tier 1 suppliers.
Illustration 2: A Texas Instruments BAII Plus Calculators. Calculators is one of many products TI offers.
In the industrial sector, TI plays a vital role in factory automation, robotics, and smart grid infrastructure, providing energy-efficient chips that optimize performance and reliability. With the rise of the Internet of Things (IoT), TI’s low-power wireless solutions, such as Bluetooth Low Energy and Wi-Fi connectivity chips, are widely used in smart home devices, wearables, and industrial IoT application
Data-Centric AI and Embedded Processing Solutions
While Texas Instruments is not a major player in high-performance computing (HPC) or AI accelerators like Intel or NVIDIA, it provides critical support components for AI-driven applications. TI’s analog chips and embedded processors are used in AI-enabled edge devices, industrial sensors, and automotive AI systems.
Additionally, Texas Instruments continues to enhance its portfolio of automotive microcontrollers and ADAS (Advanced Driver Assistance Systems) components, helping power the next generation of AI-driven vehicle safety features. Its innovations in radar and sensor fusion technology are key to enabling semi-autonomous and autonomous driving capabilities.
Key Competitors
Texas Instruments operates in a highly competitive semiconductor industry, facing strong rivals across various market segments. Its key competitors include:
Analog Devices, Inc. (ADI) – One of TI’s primary competitors in the analog semiconductor market, Analog Devices specializes in high-performance signal processing, power management, and sensor technology. ADI competes with TI in sectors such as industrial automation, automotive, and communications.
Infineon Technologies – A major player in power semiconductors and automotive electronics, Infineon competes with TI in power management ICs, microcontrollers, and sensor technologies. Its strong presence in electric vehicles (EVs) and energy-efficient semiconductor solutions makes it a formidable competitor.
STMicroelectronics (ST) – STMicroelectronics is a key rival in embedded processing and analog semiconductors, offering a broad portfolio of microcontrollers (MCUs), sensors, and power management solutions. It competes with TI in automotive, industrial, and IoT applications.
NXP Semiconductors – NXP is a strong competitor in embedded processing and automotive semiconductors, particularly in ADAS (Advanced Driver Assistance Systems), vehicle networking, and secure connectivity solutions. Its MCUs and automotive processors rival TI’s offerings in the automotive sector.
One of Texas Instruments’ strongest competitive advantages is its vertically integrated manufacturing strategy, which includes in-house fabrication of semiconductors using 300mm wafer technology. Unlike many competitors that rely on third-party foundries, TI controls its entire production process, allowing for greater cost efficiency, supply chain stability, and quality control. The use of 300mm wafers provides a significant cost advantage over traditional 200mm wafers, reducing per-chip production expenses and enabling competitive pricing. This manufacturing efficiency helps TI maintain high profit margins while ensuring long-term supply reliability, especially in high-demand markets like automotive and industrial electronics.
Another key advantage is TI’s extensive and diverse product portfolio, which spans analog and embedded semiconductors, including power management ICs, data converters, amplifiers, sensors, and microcontrollers. These products are essential across a broad range of industries, from automotive and industrial automation to consumer electronics and communications. Unlike companies that focus primarily on cutting-edge digital processors, TI specializes in long product lifecycle semiconductors, ensuring sustained demand and reducing the risk of technological obsolescence. This strategic focus allows Texas Instruments to generate consistent revenue streams and maintain leadership in key analog and embedded markets.
Texas Instruments also benefits from a strong emphasis on research and development (R&D) and customer-driven innovation. The company invests heavily in advancing semiconductor technology, particularly in areas like power efficiency, sensor integration, and wireless connectivity. TI’s deep industry relationships and extensive technical support services enable it to tailor solutions to the evolving needs of its customers, fostering long-term partnerships with major players in the automotive, industrial, and communications sectors. Additionally, TI’s robust direct sales and distribution network ensures widespread availability of its products, reinforcing its leadership position in the semiconductor market.
Future Outlook
Texas Instruments is well-positioned for sustained growth as demand for analog and embedded semiconductors continues to expand across automotive, industrial, and IoT sectors. Its strong brand, cost-efficient manufacturing, and diverse product portfolio provide a solid foundation for long-term success.
TI stands to benefit from the increasing need for power management, signal processing, and energy-efficient semiconductor solutions, particularly in EVs, factory automation, and smart infrastructure. Its 300mm wafer technology ensures cost advantages and supply chain stability, reinforcing its market leadership.
Furthermore, TI’s continued investment in R&D, manufacturing expansion, and emerging markets presents significant growth opportunities. As industries shift toward electrification and automation, Texas Instruments remains a key player in shaping the future of semiconductor innovation.
Stock Analysis
In this section we will analyze Texas Instrument’s stock to see if it is a good stock to buy or not. Our philosophy is value investing meaning that we try to find good quality companies that are undervalued. However, we will give a holistic overview so all kind of investors with different philosophies can judge the stock for themselves.
Revenueand Profits
Illustration 4 and 5: Revenue for Texas Instruments from 2009 to 2024.
As shown in illustration 4 and 5, Texas Instruments (TI) has demonstrated strong long-term revenue growth, particularly from 2009 to 2022. The company’s focus on analog and embedded processing solutions has positioned it well in the semiconductor market, driving consistent gains for much of this period. TI benefited from increasing demand across industries, including automotive, industrial, and consumer electronics.
However, despite this long-term upward trend, TI has experienced notable periods of revenue decline, particularly from 2010 to 2013 and again from 2022 to 2024. The 2010–2013 downturn was largely due to restructuring efforts, including exiting the wireless business, and broader market fluctuations. While the company rebounded strongly afterward, the more recent 2022–2024 decline raises red flags for investors. This drop has been driven by weaker demand, inventory corrections, and heightened competition in the semiconductor space. However, all in all the general trend has been positive indicating increased revenue over time, but potential investors should monitor downturn carefully and especially the reasons for them.
Illustration 6 and 7: Net Income for Texas Instruments from 2009 to 2024
Net income is a crucial metric to evaluate when determining whether a company is a worthwhile investment. It represents a company’s net profit or loss after accounting for all revenues, income items, and expenses, calculated as Net Income = Revenue – Expenses.
The net income of Texas Instruments is a red flag as it has been both volatile and on a strongly negative trend in the last couple of years, particularly from 2022 to 2024. This decline is driven by several factors, including weakening demand in key markets, inventory corrections, higher operational costs, and increased competition from other semiconductor manufacturers. Additionally, macroeconomic uncertainties and fluctuations in the semiconductor cycle have further pressured profitability. In 2024, net income saw a significant decline, raising concerns for potential investors about TI’s ability to maintain strong margins and competitive positioning. Given this negative trend, investors should closely monitor TI’s financial performance to assess whether the company can stabilize profitability and return to growth. However, all in all the general trend from 2009 to 2022 has been generally positive which indicates that the profitability over time for the company is usually positive, and that if past gains is an indicator for future gains, it will develop in a positive direction in the future again.
Revenue breakdown
Illustration 8 and 9: Revenue breakdown for Texas Instruments
The Analog segment is Texas Instruments’ largest revenue driver, contributing approximately 75-80% of total revenue. This segment includes power management, signal chain, and high-performance analog chips used in automotive, industrial, communications, and personal electronics. TI has a strong market position in analog semiconductors, but it faces increasing competition from companies like Analog Devices and Infineon. While demand has historically been strong, recent downturns in the semiconductor cycle have impacted growth.
This segment accounts for around 15-20% of TI’s revenue, focusing on microcontrollers and processors used in industrial automation, automotive systems, and communications equipment. The push toward automation and the growing electrification of vehicles have supported long-term growth in this segment. However, macroeconomic headwinds and inventory corrections have created challenges in recent years, contributing to the revenue decline from 2022 to 2024.
The remaining 5% of TI’s revenue comes from legacy businesses and other semiconductor products. While this segment is not a primary growth driver, it provides additional diversification. However, despite strong historical performance, Texas Instruments has faced a concerning decline in revenue and net income from 2022 to 2024. The company’s net income dropped from $8.7 billion in 2022 to $6.3 billion in 2023, with further declines expected in 2024 due to softening demand, rising costs, and inventory corrections. Given these financial pressures, investors should carefully monitor TI’s ability to recover and sustain long-term profitability
As seen in Illustration 8, a significant portion of Texas Instruments’ revenue is allocated to the cost of goods sold (COGS), which is expected for a semiconductor company. However, COGS does not account for as large a percentage of revenue as one might anticipate, indicating strong gross margins.
In addition, Texas Instruments invests heavily in research and development (R&D), which is a positive signal for potential investors. This commitment to innovation helps the company maintain a competitive edge in analog and embedded processing markets, ensuring long-term growth opportunities.
Overall, Texas Instruments’ revenue breakdown and expense structure present a favorable outlook for investors. The company’s diversified revenue streams and efficient cost management allow it to retain a substantial portion of earnings as net profit, reinforcing its position as a financially stable and well-managed semiconductor leader.
Earnings per Share (EPS)
Illustration 10: EPS for Texas Instruments from 2009 to 2024
Earnings Per Share (EPS) is a key financial metric that measures a company’s profitability on a per-share basis. It indicates how much profit a company generates for each outstanding share of its stock, and is used to assess a company’s financial health, profitability, and potential for growth. In other words this metric can tell us how profitable the business is.
The EPS figure itself isn’t the primary focus for value investors—it can be 0.2 or 10, but what truly matters is the company’s ability to generate consistent earnings growth. A steadily increasing EPS over time signals strong financial health, profitability, and long-term value creation.
Texas Instruments’ earnings per share (EPS) performance from 2009 to 2023 reflects a generally strong long-term trend, but recent years have shown a concerning decline. From 2009 to 2022, TI consistently grew its EPS, reaching a peak of $9.41 per share in 2022. However, in 2023, EPS dropped to $7.07, and further declines are expected in 2024 due to weakening demand, inventory corrections, and increased operational costs.
This downward trend is a red flag for investors, as it indicates that TI is struggling to maintain profit growth despite its historically strong revenue performance. However, its strong historical performance is a green sign since it shows the ability to maintain and grow profit over time. Potential Investors should in all case monitor the EPS of TI closely for sudden changes.
Assets and Liabilities
Illustration 11 and 12: Assets and Liabilities for Texas Instruments from 2009 to 2024
When evaluating a company as a potential investment, understanding its assets and liabilities is crucial. If a local business owner offered to sell their shop to you, one of the first questions—after determining its profitability—would be about its equity and assets. The same principle applies when assessing publicly traded companies like Texas Instruments.
As shown in Illustrations 11 and 12, Texas Instruments has a substantial asset base, totaling $35.5 billion in 2024. While this is lower than its competitors in the semiconductor industry, the steady asset growth over time from 2009 to 2024 is a positive sign, indicating that the company is expanding its operations, investing in new technologies, and strengthening its market position. A growing asset base often reflects a company’s ability to scale its business, acquire new projects, and improve its production capacity, which is particularly important in the competitive industry Texas Instruments is in.
At the same time, Texas Instruments’ total liabilities have also increased, rising from $2.3 billion in 2009 to $18.6 billion in 2024. . While such a sharp increase in debt might raise concerns for some investors, it is not necessarily a red flag given the nature of the semiconductor industry. Significant capital expenditures are often required for research and development, as well as for building and upgrading manufacturing facilities to remain competitive. TI has consistently invested in manufacturing capacity expansion, research and development, and supply chain resilience, which require significant capital expenditures. Unlike some competitors, TI follows a capital-efficient strategy, with a focus on maintaining strong free cash flow and shareholder returns while investing in long-term growth. However, investors should closely monitor TI’s debt levels and its ability to manage liabilities effectively, especially as profitability has declined in recent years. Ensuring that debt remains manageable and does not hinder future financial stability will be crucial for the company’s long-term success.
The key factor for investors is whether Texas Instruments can effectively manage its debt while maintaining strong revenue and profitability. If the company can generate consistent cash flow and sustain high demand for its products and services, its rising liabilities may not be a major issue. However, if debt levels continue to grow faster than revenue or profits, it could indicate financial strain, making it important for investors to monitor the company’s ability to service its obligations while maintaining profitability.
The cash on hand for Texas Instruments is a red flag for potential investors, as the company has $7.5 billion in readily available cash as of 2024. This is lower than expected, given the company’s large-scale operations and significant capital expenditures. In addition, its cash on hand is significantly lower than its long-term debt of $12.8 billion as of 2024, which indicates a potential liquidity risk. This imbalance could limit Texas Instrument’s ability to respond to unforeseen market challenges or invest in future growth opportunities without relying heavily on additional debt.
As seen in Illustration 12, Total Shareholder Equity—calculated as total assets minus total liabilities—has consistently grown over the past 14 years. This is a positive indicator for potential investors, as it suggests that Texas Instruments is building value over time rather than eroding its financial foundation. A steadily increasing shareholder equity indicates that the company’s assets are growing at a faster rate than its liabilities, which is a green flag for financial health. This trend suggests that Texas Instruments is successfully expanding its operations while maintaining a solid balance sheet. Additionally, rising equity provides a buffer against financial downturns, making the company more resilient in times of economic uncertainty. However, investors should also consider how this growth is achieved—whether through profitable operations or increased debt financing—to fully assess the sustainability of this trend. The recent dip down in total shareholder equity from 2023 to 2024 should also be strongly monitored to make sure it is not the start of a stronger downwards trend.
Debt to Equity Ratio
Illustration 13 and 14: Debt to Equity ratio for Texas Instruments from 2009 to 2024
The Debt-to-Equity (D/E) ratio is an important financial metric for assessing a company’s financial leverage and risk. It compares the amount of debt the company uses to finance its operations relative to its shareholder equity. A high D/E ratio suggests that the company relies more heavily on debt to fuel growth, which could increase financial risk, especially during economic downturns when managing debt obligations becomes more challenging. In contrast, a lower D/E ratio indicates that the company is primarily financed through equity, reducing financial risk but potentially limiting its ability to rapidly expand.
Legendary value investor Warren Buffett generally prefers a ratio below 0.5. Texas Instrument’s D/E ratio is currently above that and has been on the rise from 2009 to 2020, which indicates increasing reliance on debt financing over the past decade. This rising trend could suggest concerns about the company’s financial leverage and potential risks in managing its debt load. However, since 2020, it has had a downturn, which indicates a shift towards a more conservative approach in its capital structure. This decline could signal efforts by TI to reduce its debt and improve financial stability, making it potentially more appealing to long-term investors concerned about excessive debt. The D/E ratio of Texas Instruments have also been volatile indicating that while the company generally maintains a conservative approach to debt, fluctuations suggest occasional periods of increased financial leverage, which could pose risks if not managed effectively. This is not a red flag as long as the company don’t become too reliant on debt, especially the combination of increased debt and reduced revenue/profits should be strongly watched for.
Price to earnings ratio (P/E)
Illustration 15 and 16: P/E ratio for Texas Instruments from 2010 to 2025
For value investors, one of the most critical metrics when evaluating Texas Instrument’s stock is the price-to-earnings (P/E) ratio, as it helps assess whether the company is undervalued or overvalued. Even if a company has strong financials, purchasing its stock at a high price can lead to poor returns. For example, imagine a business generating solid profits of $1 million per year. If the owner offers to sell you the business for just $1, it would be an incredible deal. But if the owner asks for $1 trillion, even though the business is profitable, the price would be absurdly overvalued. The stock market works similarly—companies can be priced cheaply on some days and excessively expensive on others.
Warren Buffett, a legendary value investor, typically considers stocks with a P/E ratio of 15 or lower as “bargains.” A high P/E ratio suggests that investors are paying a premium for the company’s earnings, expecting significant growth. However, this also indicates that the stock is expensive relative to its earnings, which can be a red flag for value investors. The P/E of Texas Instruments has fluctuated widely in recent years, but it has over time grown from 10,15 in 2010 to 34,8 in 2025. Considering the historical prices of TI, this is also a bit high, which suggests that the stock may be overvalued relative to its fundamentals. A P/E ratio of 34.8 in 2025, combined with declining revenue and profits and increased competition, indicates that investors may be pricing in future growth expectations that might not be justified by recent financial performance. For value investors, such a high P/E ratio, especially during a period of financial weakness, is a red flag, suggesting that TI might be overpriced compared to its intrinsic value. Investors should carefully assess whether TI can justify its high valuation through future earnings growth or whether it faces risks of a price decline.
Price to book value (P/B ratio)
Illustration 17 and 18: Price to book value for Texas Instruments from 2010 to 2025.
Price-to-book value (P/B ratio) is a financial metric used to compare a company’s market value (its stock price) to its book value (the net asset value of the company, calculated as total assets minus total liabilities). The P/B ratio is calculated by dividing the current share price by the book value per share. A lower P/B ratio suggests that the stock may be undervalued, as investors are paying less for the company’s assets than their actual worth. Conversely, a high P/B ratiomay indicate that the stock is overvalued, or that investors expect high growth in the company’s future earnings. The P/B ratio is often used by value investors to assess whether a stock is trading at a fair price based on its underlying assets. Legendary Investor Warren Buffet prefers company’s with P/B lower than 1.5 and often buys around 1.3 or lower.
The price-to-book (P/B) ratio of Texas Instruments is a red flag, as it is significantly higher than its competitors and well above the levels that Warren Buffett typically considers undervalued. This suggests that the company may be overvalued relative to its book value, meaning investors are paying a high premium for its assets. Furthermore, the overall upward trend in the P/B ratio, despite a decline from 2021 to 2024, indicates that investor sentiment remains strong even as revenues and profits have weakened. This could suggest over-optimism about TI’s future growth or a disconnect between its stock price and its fundamental value. If profitability continues to decline while the P/B ratio remains high, it could signal a risk of overvaluation and potential price corrections. Investors should carefully assess whether the company’s financial performance can justify its high valuation or if the stock is trading at an unsustainable premium.
Dividend
Illustration 19: Dividend Yield and dividend payout for Texas Instruments from 2005 to 2025
Texas Instruments has established itself as a reliable dividend payer in the semiconductor industry, offering an annual dividend of $5.21 per share in 2025. This reflects the company’s commitment to returning capital to shareholders while maintaining financial stability. TI has a strong history of steady dividend growth, consistently increasing payouts since 2004, making it a favorable choice for income-seeking investors even during economic downturns.
However, there are concerns regarding TI’s dividend yield, which declined to approximately 2.8% in 2024. While the company has consistently raised its dividend over the years, slowing earnings growth and increased capital expenditures could impact future increases. Given TI’s significant investments in manufacturing expansion and R&D, there is a risk that dividend growth may slow or become less sustainable if profitability continues to decline.
✅ Green Flags:
✔ Strong Dividend History: Texas Instruments has a proven track record of dividend payments and consistent increases, making it attractive to long-term income investors. ✔ Healthy Payout Ratio: TI maintains a payout ratio around 50-60%, which suggests dividends remain sustainable under current conditions.
🚩 Red Flags:
⚠ Declining Dividend Yield: Despite rising payouts, TI’s dividend yield has dropped, signaling that stock price growth has outpaced dividend increases. ⚠ Capital-Intensive Expansion: Large investments in new manufacturing facilities and research may limit future dividend growth or put pressure on cash flow.
Insider Trading
Illustration 20: Last couple of insider trading at Texas Instruments
As shown in illustration 20, the insider trading at Texas Instrument is a red flag for potential investors as a lot of insiders are currently selling their shares in Texas Instruments. Insider selling has outpaced buying, which could be a red flag if it indicates a lack of confidence in the company’s future growth. Furthermore, the people selling stocks are the chairman of the board and high ranking officers which should be especially concerning. In addition, considering the downturn in revenue in the last couple of years this could indicate that the downwards trend could continue and that insiders don’t trust the company to turn the trend around in recent future.
Other Company Information
Founded in 1930, Texas Instruments (TI) is a global leader in semiconductor manufacturing, particularly known for its analog and embedded processing chips. As of 2024, TI employs approximately 33,000 people, reflecting a relatively stable workforce compared to previous years. The company is publicly traded on the NASDAQ under the ticker symbol TXN and operates within the Technology sector, specifically in the Semiconductors industry. As of 2024, TI has approximately 910 million shares outstanding, with a market capitalization of around $140 billion USD.
Texas Instruments is headquartered at 12500 TI Boulevard, Dallas, Texas, 75243, United States. For more information, the company’s official website is http://www.ti.com.
Final Verdict
Investing in Texas Instruments Incorporated (TI) offers a compelling mix of stability and strategic positioning. TI is a leading analog and embedded semiconductor company, known for its strong operational efficiency and long-standing commitment to returning capital to shareholders. The company has raised its dividend for 20 consecutive years, with a current dividend yield of approximately 2.9% and a payout ratio near 65%, signaling healthy cash flow management. TI’s focus on industrial and automotive markets—which together make up nearly 80% of its revenue—offers steady long-term growth potential driven by increasing chip content in everyday devices.
However, caution is still warranted. TI’s revenue declined about 10% year-over-year in 2024, reflecting cyclical headwinds and weaker demand in some end markets. Moreover, the stock trades at a P/E ratio of roughly 23, which may be considered high relative to historical averages, especially in a softening macro environment. Competition from firms like Analog Devices and Infineon is also intensifying.
Intel Corporation is a leading American multinational technology company specializing in the design and manufacturing of semiconductor chips and computing components. Headquartered in Santa Clara, California, and incorporated in Delaware, Intel has played a pivotal role in shaping modern computing. The company is best known for its microprocessors, which power the majority of personal computers (PCs) worldwide, and its contributions to high-performance computing, AI, and data center technologies.
Illustration1: Logo of the Intel corporation which symbolizes Intel’s power in peoples mind
As one of the largest semiconductor manufacturers by revenue, Intel has been a dominant force in the industry for decades. The company has consistently ranked among the top U.S. corporations on the Fortune 500 list, demonstrating its strong financial performance and market influence. Beyond CPUs, Intel produces chipsets, network interface controllers, GPUs, FPGAs, and memory solutions, making it a key player in the computing ecosystem.
History
Intel was founded on July 18, 1968, by semiconductor pioneers Gordon Moore (famous for Moore’s Law) and Robert Noyce, along with investor Arthur Rock. Under the leadership of Andrew Grove, Intel became a driving force behind Silicon Valley’s rise as a global tech hub. Initially, the company focused on SRAM and DRAM memory chips, which were its primary revenue sources until the early 1980s.
Intel’s breakthrough came in 1971 with the release of the Intel 4004, the world’s first commercial microprocessor. However, it wasn’t until the 1990s—when the PC revolution gained momentum—that microprocessors became Intel’s core business. The strategic alliance between Microsoft Windows and Intel (“Wintel”) cemented Intel’s dominance in the industry, as its CPUs became the standard for personal and enterprise computing.
By the late 1990s and early 2000s, Intel was the undisputed leader in the microprocessor market, holding over 90% market share in PC CPUs. However, the company also faced antitrust challenges and growing competition, particularly from AMD. Despite these challenges, Intel continued to innovate, pushing the boundaries of CPU performance, efficiency, and scalability.
Since the late 2010s, Intel has faced increasing competition from AMD, NVIDIA, and ARM-based processors, leading to a decline in its market dominance. However, Intel remains the leader in the x86 CPU market, holding a 68.4% share as of 2023. Unlike many of its competitors, Intel designs and manufactures its own chips, a rare advantage in the semiconductor industry where most companies rely on third-party manufacturers like TSMC and Samsung.
With a renewed focus on AI, data centers, and advanced chip manufacturing, Intel is investing heavily in next-generation process technologies and expanding its semiconductor fabrication facilities (fabs). The company aims to regain its competitive edge and reinforce its position as a leader in the evolving semiconductor landscape.
Operations and Products
Microprocessor and Semiconductor Manufacturing
Intel is one of the world’s largest manufacturers of microprocessors, producing chips for personal computers (PCs), servers, data centers, and embedded systems.
The company’s flagship Intel Core and Xeon processors power a vast majority of consumer and enterprise computing devices. Intel has remained a leader in CPU development, continuously innovating with new architectures, manufacturing nodes, and efficiency improvements.
Beyond CPUs, Intel also develops chipsets, graphics processing units (GPUs), memory solutions (Optane SSDs), and field-programmable gate arrays (FPGAs). The company manufactures its own chips in Intel Foundry Services (IFS), distinguishing itself from competitors like AMD and NVIDIA, which rely on third-party fabs like TSMC. Intel is actively investing in advanced semiconductor fabrication and is working towards regaining leadership in chip manufacturing with cutting-edge process nodes like Intel 4 and Intel 3.
Data Centric AI Solutions
Intel has expanded beyond traditional computing into AI, cloud computing, and data center technologies. The Intel Xeon Scalable Processors dominate the server and cloud computing markets, providing businesses with high-performance computing (HPC) and enterprise-grade AI capabilities.
Additionally, Intel’s AI-focused hardware, including Intel Gaudi AI accelerators and Intel Arc GPUs, is designed to compete in the growing machine learning and artificial intelligence sectors. The company is also actively involved in networking and 5G infrastructure, offering programmable solutions for cloud service providers and telecom operators.
Illustration 2: An Intel Core CPU, which is part of its core business
Emerging Technologies and Future Growth Areas
Intel is making significant investments in next-generation semiconductor technologies, energy-efficient computing, and quantum computing. The company’s R&D efforts focus on improving chip performance, reducing power consumption, and enhancing cybersecurity.
As part of its strategic expansion, Intel is also developing self-driving car technologies through Mobileye, a subsidiary specializing in automotive AI and autonomous vehicle systems. With the increasing demand for AI computing and data processing, Intel is positioning itself as a key player in the evolving technology landscape.
Revenue Breakdown
Client Computing Group (CCG) – This segment accounts for 50-55% of Intel’s total revenue, making it the largest contributor. It includes the sale of Intel Core processors for laptops, desktops, and other personal computing devices. While Intel remains a dominant force in the PC processor market, it faces increasing competition from AMD and Apple’s in-house silicon.
Illustration 3: Revenue breakdown for Intel Corporation from Tipranks.
Data Center and AI Group (DCAI) – Responsible for 30-35% of Intel’s revenue, this segment focuses on Intel Xeon processors, AI accelerators, and cloud computing solutions. With the increasing adoption of AI and high-performance computing (HPC), Intel continues to expand its data center offerings. However, growing competition from NVIDIA and AMD has pressured this segment’s growth.
Network and Edge (NEX) & Foundry Services – Contributing 10-15% of Intel’s revenue, these segments include 5G network infrastructure, edge computing, and custom semiconductor manufacturing (Intel Foundry Services, or IFS). Intel is investing heavily in chip fabrication to compete with TSMC and Samsung while strengthening its position in the semiconductor supply chain.
Mobileye & Other Emerging Technologies – This is Intel’s smallest revenue segment, contributing 5-10%. Mobileye specializes in autonomous vehicle technology, providing ADAS (Advanced Driver Assistance Systems) and AI-powered automotive solutions. Intel is also making strides in quantum computing, neuromorphic chips, and AI-focused hardware.
Key Competitors
Intel operates in a highly competitive semiconductor industry, facing strong rivals across different market segments. Its key competitors include:
AMD (Advanced Micro Devices, Inc.) – Intel’s primary competitor in the CPU market, AMD has gained significant market share with its Ryzen and EPYC processor lines. AMD’s Zen architecture has challenged Intel’s dominance in both consumer and data center markets, particularly in multi-core performance and power efficiency.
NVIDIA Corporation – While historically focused on graphics processing units (GPUs), NVIDIA has expanded into AI, high-performance computing (HPC), and data centers, areas that overlap with Intel’s Xeon and AI accelerator businesses. NVIDIA’s CUDA ecosystem and AI chips (such as the H100 and upcoming Blackwell series) present a major challenge to Intel’s ambitions in AI-driven computing.
TSMC (Taiwan Semiconductor Manufacturing Company) – As the world’s largest contract chip manufacturer, TSMC produces cutting-edge chips for companies like Apple, AMD, and NVIDIA. Intel is attempting to compete in semiconductor manufacturing with its Intel Foundry Services (IFS), but TSMC leads in advanced process nodes (e.g., 3nm, 5nm), posing a significant challenge to Intel’s manufacturing business.
Competitive Advantage
Unlike many competitors that depend on third-party foundries like TSMC, Intel both designs and manufactures its own chips, allowing for greater control over production, innovation, and supply chain management. The company makes significant investments in R&D, focusing on advanced semiconductor technology, AI, high-performance computing (HPC), and quantum computing. Intel remains a leader in processor architecture, driving advancements in Intel Core, Xeon, and AI-powered accelerators.
Illustration 4: Outside Intel’s headquarters in Santa Clara, California.
With breakthrough technologies like Intel 3 and Intel 18A process nodes, Intel is working to regain process leadership in semiconductor manufacturing. Its vertically integrated model, which combines chip design and fabrication in-house, offers long-term cost efficiencies and technological advantages over competitors that outsource production.
Intel’s comprehensive product lineup spans PC processors (Intel Core), data center solutions (Xeon), GPUs (Intel Arc), networking hardware, AI accelerators, and foundry services, ensuring its strong presence across multiple high-growth technology sectors.
Future Outlook
Looking ahead, Intel Corporation is well-positioned to drive future growth as demand for high-performance computing, AI, and semiconductor innovation continues to rise. The company’s strong brand, cutting-edge technology, and global manufacturing footprint provide a solid foundation for long-term success.
Intel stands to benefit from government initiatives supporting domestic semiconductor production, such as the CHIPS Act, which aims to boost U.S. chip manufacturing. With increasing demand for AI accelerators, data center solutions, and advanced semiconductor nodes, Intel is expected to remain a key player in the industry.
Furthermore, Intel’s expansion into new markets, including foundry services, AI-driven computing, and emerging global tech hubs, presents significant growth opportunities in the coming years.
Stock Analysis
In this section we will analyze Intel Corporation’s stock to see if it is a good stock to buy or not. Our philosophy is value investing meaning that we try to find good quality companies that are undervalued. However, we will give a holistic overview so all kind of investors with different philosophies can judge the stock for themselves.
Revenue and Profits
To determine a company’s worth and if it is worth investing in, the company’s revenue and profits are a natural starting point to analyze. It should never bee forgotten that a stock represents a company just like the small businesses in your home town. If someone asked you if you want to buy their company, the first question would naturally be how much the company makes and the same question when trying to analyze if a company registered in the stock exchange is worth buying.
Illustration 5 and 6: Revenue for Intel Corporation from 2009 to 2024
As shown in recent financial reports, Intel Corporation has experienced steady revenue growth over the long term, particularly in recent years. In 2023, Intel’s revenue was approximately $63.1 billion, driven by rising global demand for high-performance computing, AI, data center solutions, and semiconductor innovation. Intel’s expansion into new markets, such as AI accelerators and foundry services, as well as increased demand for data center chips and consumer processors, continues to support its growth trajectory.
However, despite this general upward trend, Intel’s revenue growth has faced some volatility. As seen in recent years, Intel’s revenue declined in 2021 and 2024, largely due to increased competition in the semiconductor industry, challenges in transitioning to new process technologies, and market fluctuations. For investors, this volatility could be a concern, as it suggests that Intel’s revenue growth may not always be consistent, making it a potentially riskier investment compared to companies with more predictable financial performance. Increased competition has also eaten Intel’s market share leading to a concerning decrease in decline from 2021 to 2024. Even though Intel’s revenue before this was on an increasing trend upwards, the recent decline should be red flag as increased competition in the industry is to be expected to be a lasting problem.
Illustration 7 and 8: Net Income for Intel Corporation from 2009 to 2024
Net income is a crucial metric to evaluate when determining whether a company is a worthwhile investment. It represents a company’s net profit or loss after accounting for all revenues, income items, and expenses, calculated as Net Income = Revenue – Expenses.
The Net Income of Intel Corporation is a red flag as it has been both volatile and on a strongly negative trend in the last couple of years, as can be seen in illustration 8 from 2021 to 2024. This negative trend is due to several factors, including increased competition from companies like AMD and Nvidia, higher operational costs, delays in transitioning to new manufacturing processes, and investments in long-term projects such as AI and semiconductor R&D. The Net Income in 2024 was negative, which is a red flag for potential investors, as it signals a lack of profitability and could indicate challenges in maintaining competitive market positioning. The net income of intel should be watched very closely be any potential investors.
Revenue breakdown
Illustration 9: Revenue Breakdown of Intel Corporation
As can be seen from illustration 9, Intel Corporation has a good variety of different revenue sources in the technology sector, which is a positive sign as it shows the company’s diversification and ability to capitalize on multiple markets. COGS and operating expenses eat up a good part of the profit, which is to be expected in a capital-intensive industry. However, a very positive sign for Intel is that the majority of its operating expenses is allocated to R&D. This investment in research and development in the long term provides Intel with better technology, a competitive advantage, and the ability to stay at the forefront of innovation in areas such as AI, high-performance computing, and semiconductor manufacturing. This focus on R&D positions Intel well for future growth and resilience in the highly competitive tech sector. The revenue breakdown of intel corporation is a green flag for potential investors.
Earnings per shar (EPS)
Earnings Per Share (EPS) is a key financial metric that measures a company’s profitability on a per-share basis. It indicates how much profit a company generates for each outstanding share of its stock, and is used o assess a company’s financial health, profitability, and potential for growth. In other words this metric can tell us how profitable the business is.
Illustration 10: Earnings per share for Intel Corporation from 2009 to 2024
The EPS figure itself isn’t the primary focus for value investors—it can be 0.2 or 10, but what truly matters is the company’s ability to generate consistent earnings growth. A steadily increasing EPS over time signals strong financial health, profitability, and long-term value creation.
Intel Corporation’s earnings per share (EPS) performance from 2009 to 2023 presents a mixed picture for investors. While the company has demonstrated resilience and growth in revenue over the long term, its EPS has in recent years been falling quite dramatically and is, as of the moment, strongly negative. This is a red flag due to the company’s inability to convert revenue growth into consistent profit growth, which suggests operational or market challenges. Factors such as increasing competition in the semiconductor industry, delays in product development, and rising costs have likely contributed to the decline in EPS. For investors, the negative EPS signals potential risks in Intel’s ability to sustain profitability, making it an important indicator to monitor moving forward.
Assets and Liabilities
Illustration 11 and 12: Assets, Liabilities and Total Shareholder Equity for Intel Corporation from 2009 to 2024.
When evaluating a company as a potential investment, understanding its assets and liabilities is crucial. If a local business owner offered to sell their shop to you, one of the first questions—after determining its profitability—would be about its equity and assets. The same principle applies when assessing publicly traded companies like Dominion Energy.
As shown in Illustrations 11 and 12, Intel Corporation has a substantial asset base, totaling $196.5 billion in 2024. This steady asset growth over time is a positive sign, indicating that the company is expanding its operations, investing in new technologies, and strengthening its market position. A growing asset base often reflects a company’s ability to scale its business, acquire new projects, and improve its production capacity, which is particularly important in the highly competitive industry Intel is in.
At the same time, Intel Corporation’s total liabilities have also increased significantly, rising from $10.8 billion in 2009 to $72.1 billion in 2024. While such a sharp increase in debt might raise concerns for some investors, it is not necessarily a red flag given the nature of the semiconductor industry. Significant capital expenditures are often required for research and development, as well as for building and upgrading manufacturing facilities to remain competitive. This debt is primarily used to fuel Intel’s innovation and expansion in critical technologies like AI, high-performance computing, and next-generation chips. However, investors should closely monitor Intel’s debt levels and ability to service them, especially in light of recent profitability struggles, to ensure it doesn’t become a long-term risk to the company’s financial health.
The key factor for investors is whether Intel Corporation can effectively manage its debt while maintaining strong revenue and profitability. If the company can generate consistent cash flow and sustain high demand for its products and services, its rising liabilities may not be a major issue. However, if debt levels continue to grow faster than revenue or profits, it could indicate financial strain, making it important for investors to monitor the company’s ability to service its obligations while maintaining profitability.
The cash on hand for Intel Corporation is a red flag for potential investors, as the company has $22 billion in readily available cash as of 2024. This is lower than expected, given the company’s large-scale operations and significant capital expenditures. In addition, its cash on hand is significantly lower than its long-term debt of $46.3 billion as of 2024, which indicates a potential liquidity risk. This imbalance could limit Intel’s ability to respond to unforeseen market challenges or invest in future growth opportunities without relying heavily on additional debt.
As seen in Illustration 11, Total Shareholder Equity—calculated as total assets minus total liabilities—has consistently grown over the past 14 years. This is a positive indicator for potential investors, as it suggests that Intel Corporation is building value over time rather than eroding its financial foundation. A steadily increasing shareholder equity indicates that the company’s assets are growing at a faster rate than its liabilities, which is a green flag for financial health. This trend suggests that Intel Corporation is successfully expanding its operations while maintaining a solid balance sheet. Additionally, rising equity provides a buffer against financial downturns, making the company more resilient in times of economic uncertainty. However, investors should also consider how this growth is achieved—whether through profitable operations or increased debt financing—to fully assess the sustainability of this trend. The recent dip down in total shareholder equity from 2023 to 2024 should also be strongly monitored to make sure it is not the start of a stronger downwards trend.
Debt to Equity Ratio
Illustration 12 and 13: Debt to Equity ratio of Intel Corporation
The Debt-to-Equity (D/E) ratio is an important financial metric for assessing a company’s financial leverage and risk. It compares the amount of debt the company uses to finance its operations relative to its shareholder equity. A high D/E ratio suggests that the company relies more heavily on debt to fuel growth, which could increase financial risk, especially during economic downturns when managing debt obligations becomes more challenging. In contrast, a lower D/E ratio indicates that the company is primarily financed through equity, reducing financial risk but potentially limiting its ability to rapidly expand.
Legendary value investor Warren Buffett generally prefers a ratio below 0.5. Intel Corporation’s D/E ratio is currently above that and has been on the rise from 2009 to 2020, which indicates increasing reliance on debt financing over the past decade. This rising trend could suggest concerns about the company’s financial leverage and potential risks in managing its debt load. However, since 2020, it has had a downturn, which indicates a shift towards a more conservative approach in its capital structure. This decline could signal efforts by Intel to reduce its debt and improve financial stability, making it potentially more appealing to long-term investors concerned about excessive debt.
Price to earnings ratio (P/E)
Illustration 14 and 15: Price to earnings ratio for Intel Corporation from 2010 to 2024
For value investors, one of the most critical metrics when evaluating Intel Corporation’s stock is the price-to-earnings (P/E) ratio, as it helps assess whether the company is undervalued or overvalued. Even if a company has strong financials, purchasing its stock at a high price can lead to poor returns. For example, imagine a business generating solid profits of $1 million per year. If the owner offers to sell you the business for just $1, it would be an incredible deal. But if the owner asks for $1 trillion, even though the business is profitable, the price would be absurdly overvalued. The stock market works similarly—companies can be priced cheaply on some days and excessively expensive on others.
Warren Buffett, a legendary value investor, typically considers stocks with a P/E ratio of 15 or lower as “bargains.” A high P/E ratio suggests that investors are paying a premium for the company’s earnings, expecting significant growth. However, this also indicates that the stock is expensive relative to its earnings, which can be a red flag for value investors. Intel Corporation’s P/E has fluctuated in recent years, even being negative in 2023 and jumping to a high of 45.53 in 2023, which indicates a period of strong market expectations and speculative growth. However, this spike in the P/E ratio also raises concerns about the stock being overpriced relative to its actual earnings, making it potentially risky for investors who prefer to buy undervalued stocks. This volatility suggests uncertainty about Intel’s ability to meet the high growth expectations embedded in its valuation. As of now, Intel can be said to be overvalued as its earning are going down, buts its P/E ratio at the same time is going up reaching new hight which is not supported by the Company’s fundamentals.
Price to Book Value
Illustration 16 and 17: Price to Book ratio for Intel Corporation from 2010 to 2025.
Price-to-book value (P/B ratio) is a financial metric used to compare a company’s market value (its stock price) to its book value (the net asset value of the company, calculated as total assets minus total liabilities). The P/B ratio is calculated by dividing the current share price by the book value per share. A lower P/B ratio suggests that the stock may be undervalued, as investors are paying less for the company’s assets than their actual worth. Conversely, a high P/B ratiomay indicate that the stock is overvalued, or that investors expect high growth in the company’s future earnings. The P/B ratio is often used by value investors to assess whether a stock is trading at a fair price based on its underlying assets. Legendary Investor Warren Buffet prefers company’s with P/B lower than 1.5 and often buys around 1.3 or lower.
Intel Corporation’s price-to-book (P/B) ratio has seen notable fluctuations from 2010 to 2025, reflecting varying market perceptions and financial performance. Throughout the 2010s, Intel’s P/B ratio was typically above 2, indicating that investors were willing to pay a premium for its assets, likely due to strong market positioning and expected growth in the semiconductor industry. However, in recent years, the ratio has been more volatile, dropping below 1 in certain periods, signaling potential undervaluation or market skepticism about its future earnings growth, especially with increasing competition and declining margins. As of 2024-2025, Intel’s P/B ratio remains relatively low, suggesting that the stock may be undervalued compared to its book value, which could present a green flag for value investors looking for opportunities. Nevertheless, this could also be a red flag if the low P/B ratio reflects market concerns about Intel’s long-term competitive position, particularly amid shifts in the tech industry.
Dividend
Illustration 18: Intel Corporation Dividend from 2005 to 2025
Intel Corporation has established itself as a reliable dividend payer within the technology sector, offering an annual dividend of $0.52 per share in 2025. This reflects the company’s commitment to rewarding shareholders and maintaining financial stability. Intel has a long history of steady dividend payments, consistently delivering returns to investors, even during periods of market volatility and economic uncertainty. This has made it a favorable choice for income-seeking investors.
However, there are concerns regarding Intel’s dividend yield, which has recently seen a decline, now standing at 2.15%. While the company has consistently raised its dividend since 2005, the first-ever decrease in 2024-2025 to $0.52 per share in 2025 raises red flags. This marks a shift in Intel’s dividend strategy and signals potential challenges ahead, particularly given the capital-intensive nature of the business, including significant investments in research, development, and manufacturing.
To summarize:
✅ Green Flag:
Reliable Dividend Payouts: Intel has a strong history of dividend payments, making it an appealing option for investors seeking consistent income.
Long-Term Growth Potential: The company combines steady dividends with prospects for growth in the technology sector.
🚩 Red Flag:
Declining Dividend Yield: The recent drop in Intel’s dividend yield is concerning for income investors who rely on stable returns.
Capital Intensity: Intel’s ongoing investments in innovation and capital expenditures raise questions about the long-term sustainability of its dividend payouts.
Insider Trading
In 2024, Intel Corporation’s insider trading activities included purchases totaling approximately $882,574, with no recorded sales. The most recent insider transaction was on November 7, 2024, when EVP Michelle Johnston Holthaus sold 25,000 shares at $26.00 per share, amounting to $650,000. In 2025, there were no reported insider purchases or sales; however, option exercises occurred, totaling 108,713 shares. These transactions suggest active insider engagement, but the absence of sales in 2025 may raise some questions.
✅ Green Flag: The lack of insider sales in 2025 and limited purchases in 2024 can be seen as a positive, as it may indicate confidence in the company’s future prospects and a long-term outlook from insiders.
🚩 Red Flag: The lack of insider sales in 2025 could be viewed as a potential red flag by some investors, as it may suggest insiders are not capitalizing on stock opportunities, which could be a sign of caution or internal concerns.
Other Company Information
Intel Corporation, founded in 1968, currently employs approximately 121,100 individuals as of 2024, reflecting a steady workforce presence that has grown from 110,000 employees in 2020. Originally established as Integrated Electronics Corporation, Intel is a global leader in semiconductor innovation, particularly known for its microprocessors. The company is publicly traded on the NASDAQ under the ticker symbol INTC. Operating within the Technology sector, Intel is classified under the Semiconductors industry. As of 2024, Intel has approximately 4.1 billion shares outstanding, with a market capitalization of around $100 billion USD.
Headquartered at 2200 Mission College Blvd, Santa Clara, California 95054, United States, Intel’s official website is www.intel.com.
Illustration 19-21: Number of employees at Intel and its headquarters location in Santa Clara.
Final Verdict
Investing in Intel Corporation presents both opportunities and risks. On the positive side, Intel is a leader in semiconductor manufacturing, with a solid history of innovation and consistent dividend payouts. Its diversified portfolio, which includes processors, AI accelerators, and foundry services, positions it well for long-term growth, especially with the increasing demand for advanced technology across multiple sectors. However, recent challenges, such as declining earnings, volatile dividend yields, and increasing competition from companies like AMD and Nvidia, should not be overlooked. It is also not easy to determine if Intel currently is overpriced or not as the P/E ratio and P/B ratio point in different direction. As of now the final conclusion is to be careful and cautious before buying Intel stock.
NextEra Energy, Inc. is one of the largest energy companies in the United States and a global leader in renewable energy. With a strong commitment to sustainability and innovation, NextEra Energy has positioned itself as a key player in the transition toward cleaner energy solutions. The company primarily focuses on generating electricity through renewable sources while maintaining reliability and affordability for millions of customers.
Illustration 1: NextEra Energy logo, symbolizing renewable energy with use of green colour and leaf like wave.
History and Background
NextEra Energy traces its origins back to 1925, when it was founded as Florida Power & Light Company (FPL). Over the years, the company expanded its operations and evolved into a diversified energy powerhouse. In 1984, FPL Group was established as the parent company, and in 2010, it was rebranded as NextEra Energy to reflect its growing emphasis on renewable energy.
Today, NextEra Energy is headquartered in Juno Beach, Florida, and has grown through strategic acquisitions and investments in wind, solar, and battery storage technologies. The company owns and operates one of the world’s largest portfolios of renewable energy assets, making it a key player in the clean energy transition.
Operation and Services
NextEra Energy serves a vast customer base across 49 states in the U.S. and four Canadian provinces. The company operates through two major business segments:
Florida Power & Light Company (FPL) – This segment focuses on electricity generation, transmission, and distribution in Florida. It is the backbone of the company’s regulated electric utility business, serving over 5.8 million customer accounts
NextEra Energy Resources – This segment handles renewable energy generation, including wind, solar, and battery storage projects. It also manages natural gas pipelines and nuclear power plants, ensuring that NextEra Energy is a key player in the transition toward cleaner energy sources
As can be seen from illustration two, the majority of NextEra’s energy generation comes from wind and solar power.
Illustration 2: The generation allocation of NextEra Energy
Wind Energy makes up 67% of its generation while solar makes up 13%. NextEra Enegy is as such a fanatstic company to invest in for those that want to be exposed to the renewable energy market.
The company is also invested in nuclear energy, constituiting 11% of its total energy generation, while only a minor part of the business constituting 6% is part of the Natural gas market.
Challenges and Controversies
Environmental Concerns:Despite its significant investments in renewable energy, NextEra Energy has faced criticism for its environmental impact. The company has been involved in disputes over the development of certain projects that environmental groups claim disrupt ecosystems and communities. Additionally, the capital-intensive nature of renewable energy projects has raised concerns about the sustainability of its financial practices
Regulatory and Legal Issues: Operating in a highly regulated industry, NextEra Energy has encountered various regulatory and legal challenges. These include disputes over rate adjustments, infrastructure expansion, and compliance with federal and state environmental laws. The company has also been involved in legal battles to block competing energy projects, which has drawn scrutiny and criticism
Competition
NextEra Energy operates in a highly competitive landscape, facing significant competition from other major utility and renewable energy companies. Some of its main competitors include: Southern Company (SO), Duke Energy (DUK), Entergy (ETR9, PPL Corporation (PPL), FirstEnergy (FE), Eversource Energy (ES), Edison International (EIX), Pinnacle West Capital (PNW), OGE Energy (OGE), and IDACORP (IDA).
These companies are all part of the electric utilities industry and compete with NextEra Energy in various aspects, including market share, technological advancements, and regulatory compliance.
NextEra Energy stands out from its competitors by being the world’s largest generator of wind and solar power, leading the transition to a low-carbon future. Its size and expertise gives it a competitive advantage. The investments the company has made in getting more advanced technologies to enhance efficiency and reduce costs, also solidifies their competitive edge.
However, the highly competitive environment in which they operate is a factor that investors should carefully consider, as it could pose potential risks.
Future outlook
Several factors will shape NextEra Energy’s future:
Expansion of Offshore Wind: NextEra Energy’s offshore wind projects will play a critical role in achieving clean energy goals. As more offshore wind projects receive government backing, NextEra stands to benefit from regulatory support and technological advancements.
Electrification of Transportation: As electric vehicle (EV) adoption grows, NextEra Energy is investing in EV infrastructure, including charging stations and grid upgrades to accommodate increased demand.
Advancements in Energy Storage: The development of more efficient and cost-effective battery storage solutions will be crucial for integrating intermittent renewable energy sources like solar and wind.
Stock Analysis
In this section, we will analyze NextEra Energy stock to determine if it is a good investment. Our philosophy is value investing, which means we seek high-quality companies that are undervalued. However, we will provide a comprehensive overview so that investors with different philosophies can evaluate the stock for themselves.
Revenue and Profits
To assess a company’s value and investment potential, revenue and profits are the logical starting points for analysis. A stock represents an actual business, much like the small businesses in your hometown. If someone offered to sell you their company, your first question would likely be about its earnings. The same principle applies when evaluating a publicly traded company—understanding its financial performance is essential before deciding to invest.
Illustration 2 and 3: Revenue of NextEra Energy from 2009 to 2024.
As seen in Illustrations 2 and 3, NextEra Energy’s revenue has shown a long-term growth, particularly in recent years. This expansion is driven by increasing demand for renewable energy, investments in infrastructure, and the company’s leadership in wind and solar power generation. Additionally, supportive government policies, tax incentives, and commitments to clean energy continue to drive sales, positioning NextEra Energy for sustained growth.
However, despite this overall upward trend, NextEra Energy’s revenue growth has experienced fluctuations. As shown in Illustrations 2 and 3, there have been periods where revenue declined due to factors such as regulatory changes, shifts in energy prices, and project timing. The utility and renewable energy sectors are subject to policy adjustments and market dynamics that can impact earnings, making it essential for investors to consider these risks. It is especially important to note that the Trump administration is opposed to the Wind sector which stands for the majority of NextEra’s energy generation.
Even with occasional volatility, the long-term outlook remains strong. With the increasing global transition to renewable energy, NextEra Energy is well-positioned to capitalize on this shift. Its investments in clean energy infrastructure, expansion into emerging markets, and strong operational efficiency suggest a promising future despite short-term revenue fluctuations. However, it has a lot of competitors and the current US administration is not as supportive of renewable energy as previous administrations.
Illustration 4 and 5: Net Income of NextEra Energy from 2009 to 2025
Net income is a crucial metric to evaluate when determining whether a company is a worthwhile investment. It represents a company’s net profit or loss after accounting for all revenues, income items, and expenses, calculated as Net Income = Revenue – Expenses.
As illustrated in Figures 4 and 5, NextEra Energy has experienced significant net income growth over the long term, particularly in recent years. For instance, the company’s net income rose from $3.573 billion in 2021 to $4.147 billion in 2022, marking a 16.06% increase. This upward trend continued in 2023, with net income reaching $7.31 billion—a substantial 76.27% increase from the previous year. This growth is driven by rising global demand for renewable energy, strategic investments in wind and solar projects, and expansion into energy storage and infrastructure development. Additionally, favorable government policies and commitments to clean energy continue to fuel revenue, positioning the company for sustained growth.
However, despite this overall upward trend, NextEra Energy’s net income has experienced fluctuations. In 2024, the company’s net income decreased by approximately 8.79% to $6.952 billion, down from $7.31 billion in 2023. This decline is partly due to increased costs impacting its renewables segment and higher operating expenses. And ofcoursw it had a sharp fall from 2018 to 2020. For investors, this inconsistency raises concerns, as it suggests that NextEra Energy may not deliver steady net income growth year after year, making it a potentially riskier investment compared to companies with more predictable financial performance. Even though net income growth has been inconsistent, the long-term trend remains upward. Considering the rising global demand for energy, the increasing popularity of renewable power, and the momentum of the green energy transition, NextEra Energy is well-positioned for future growth. These factors, combined with the company’s expanding project backlog and strategic partnerships, suggest a promising outlook despite short-term volatility.
Revenue breakdown
Illustration 6: Revenue Breakdown for NextEra Energy, gathered from gurufocus as of NOV 31, 2023.
As can be seen in Illustration 6, the majority of NextEra Energy’s revenue comes from Florida Power & Light Company, but a significant portion (17.8%) is generated by NextEra Energy Resources LLC. This diversification provides investors with exposure to both clean energy growth and the stability of a traditional utility business. Despite cost of goods sold (COGS) consuming a substantial share of its revenue, the company continues to have a significant and good amount of revenue. Additionally, high capital expenditures for clean energy development and grid modernization impact profitability. While NextEra Energy benefits from a strong market position and steady utility revenue, these costs could affect its long-term earnings growth, making it an important factor for investors to consider.
Earnings per shar (EPS)
Earnings Per Share (EPS) is a key financial metric that measures a company’s profitability on a per-share basis. It indicates how much profit a company generates for each outstanding share of its stock, and is used o assess a company’s financial health, profitability, and potential for growth. In other words this metric can tell us how profitable the business is.
Illustration 7: Earnings per share for NextEra Energy from 2009 to 2025
The EPS figure itself isn’t the primary focus for value investors—it can be 0.2 or 10, but what truly matters is the company’s ability to generate consistent earnings growth. A steadily increasing EPS over time signals strong financial health, profitability, and long-term value creation.
The EPS for NextEra Energy has had a generally positive upward trend since 2009. However, it experienced a dramatic fall from 2019 to 2020 due to the economic downturn and market disruptions caused by the COVID-19 pandemic, along with increased costs and project delays. This decline can be a red flag for investors, as it highlights the company’s sensitivity to external economic factors and potential volatility in earnings. However, after the fall, the trend has resumed its upward trajectory, supported by strong investments in renewable energy, stable utility revenue from Florida Power & Light, and favorable industry policies. As a result, the EPS has now returned to pre-fall levels, reinforcing NextEra Energy’s resilience and long-term growth potential. The pandemic can also be considered a one-time event, and the fall in 2024 due to rising interest rates and increased costs in the renewables sector can also be seen as a temporary setback rather than a long-term structural issue. Given NextEra Energy’s strong track record of recovery and consistent long-term growth, these fluctuations are likely part of normal business cycles rather than a sign of fundamental weakness.
Assets and Liabilities
Illustration 8 and 9: Assets and liabilities for NextEra Energy from 2009 to 2023
When evaluating a company as a potential investment, understanding its assets and liabilities is crucial. If a local business owner offered to sell their shop to you, one of the first questions—after determining its profitability—would be about its equity and assets. The same principle applies when assessing publicly traded companies like Dominion Energy.
As shown in Illustration 8, NextEra Energy’s total assets reached $177.5 billion in 2023, a strong figure that highlights the company’s financial growth. Additionally, NextEra Energy’s asset base has consistently expanded year over year, increasing from $48.5 billion in 2009 to $177.5 billion in 2023. This steady asset growth is a positive indicator of the company’s ongoing expansion, investments in innovative technologies, and strengthened market position. A continuously growing asset base often signifies a company’s ability to scale operations, acquire new projects, and enhance production capacity which is particularly important in the highly competitive renewable energy industry.
At the same time, NextEra’s total liabilities have also increased significantly, rising from $35.5 billion in 2009 to $119.7 billion in 2023. While such a sharp increase in debt might raise concerns for some investors, it is not necessarily a red flag given the nature of the renewable energy business. Utility companies typically operate in a capital-intensive environment where they must secure substantial financing to fund large-scale projects, develop infrastructure, and maintain their competitive edge. Debt financing is often necessary for expanding wind farm and other types of energy production, all of which contribute to long-term growth.
The key factor for investors is whether NextEra can effectively manage its debt while maintaining strong revenue and profitability. If the company can generate consistent cash flow and sustain high demand for its products and services, its rising liabilities may not be a major issue. However, if debt levels continue to grow faster than revenue or profits, it could indicate financial strain, making it important for investors to monitor the company’s ability to service its obligations while maintaining profitability.
The cash on hand for NextEra is a red flag for potential investors, as the company has $2.7 billion in readily available cash as of 2023. This amount is relatively low compared to its liabilities, which could indicate liquidity concerns and a reliance on external financing to meet obligations and fund growth.
Additionally, NextEra’s long-term debt of $61.4 billion in 2023 is significantly higher than its available cash, which is a red flag for investors. This indicates that the company relies heavily on debt financing, which could pose risks if interest rates rise or if cash flow weakens, potentially impacting its ability to meet financial obligations and sustain growth.
As seen in Illustration 9, Total Shareholder Equity—calculated as total assets minus total liabilities—has consistently grown over the past 14 years. This is a very positive indicator for potential investors, as it suggests that NextEra is building value over time rather than eroding its financial foundation. A steadily increasing shareholder equity indicates that the company’s assets are growing at a faster rate than its liabilities, which is a green flag for financial health. This trend suggests that NextEra is successfully expanding its operations while maintaining a solid balance sheet. Additionally, rising equity provides a buffer against financial downturns, making the company more resilient in times of economic uncertainty. However, investors should also consider how this growth is achieved—whether through profitable operations or increased debt financing—to fully assess the sustainability of this trend.
Debt to Equity Ratio
Illustration 10 and 11: Debt to equity for NextEra Energy from 2009 to 2023
The Debt-to-Equity (D/E) ratio is an important financial metric for assessing Next Era’s financial leverage and risk. It compares the amount of debt the company uses to finance its operations relative to its shareholder equity. A high D/E ratio suggests that the company relies more heavily on debt to fuel growth, which could increase financial risk, especially during economic downturns when managing debt obligations becomes more challenging. In contrast, a lower D/E ratio indicates that Next Era is primarily financed through equity, reducing financial risk but potentially limiting its ability to rapidly expand.
The D/E ratio of NextEra Energy has been on a downward trend from around 2.8 in 2009–2010 to 2.05 in 2024. This is a positive sign for investors since it indicates that the company is gradually reducing its reliance on debt relative to equity. A lower D/E ratio suggests improved financial stability, reduced risk of overleveraging, and a stronger ability to manage long-term obligations while continuing to invest in growth.
Legendary value-investor Warren Buffett prefers a D/E ratio of below 0.5. Compared to 0.5, NextEra is still at a very high level. However, this is normal for companies in the renewable utility industry since they often require significant capital investment to fund large-scale projects, develop infrastructure, and expand renewable energy capacity. While NextEra’s D/E ratio is higher than Buffett’s preferred level, it reflects the capital-intensive nature of the energy sector and the company’s ongoing efforts to scale its operations and meet growing demand for clean energy.
Price to earnings ratio (P/E)
Illustration 12 and 13: Price to earnings ratio for NextEra Energy from 2009 to 2023
For value investors, one of the most critical metrics when evaluating NextEra’s stock is the price-to-earnings (P/E) ratio, as it helps assess whether the company is undervalued or overvalued. Even if a company has strong financials, purchasing its stock at a high price can lead to poor returns. For example, imagine a business generating solid profits of $1 million per year. If the owner offers to sell you the business for just $1, it would be an incredible deal. But if the owner asks for $1 trillion, even though the business is profitable, the price would be absurdly overvalued. The stock market works similarly—companies can be priced cheaply on some days and excessively expensive on others.
Warren Buffett, a legendary value investor, typically considers stocks with a P/E ratio of 15 or lower as “bargains.” A high P/E ratio suggests that investors are paying a premium for the company’s earnings, expecting significant growth. However, this also indicates that the stock is expensive relative to its earnings, which can be a red flag for value investors. NextEra’s P/E ratio has been on a relatively stable level from 2010 to 2018. From 2018 as renewable stocks became popular on the stock market its P/E skyrocket to a high of 107.21 in 2022 which is strongly overprices. Before the bubble burst and it came back to 17.19 in 2024.
The mania for renewable energy stocks seems to have slowed down after the bubble burst in 2022. For potential investors, the P/E of 20.2 in 2025 seems fairly priced, meaning that you will not be buying at a bargain but also not overpaying for the stock. If you believe in the company’s future earnings potential and strong fundamentals, it could be a good time to enter at a reasonable valuation and hold for long-term growth.
Dividend
Illustration 14: NextEra Energy’s dividend yield and dividend payout from 1995 to 2025
NextEra Energy stands out among renewable energy companies by offering a consistent dividend, making it an attractive option for income-focused investors. In 2025, NextEra’s annual dividend is $1.55 per share, reflecting its commitment to returning value to shareholders. Additionally, the company has a strong track record of increasing its dividend, with a five-year annualized growth rate of approximately 10%, demonstrating steady financial health and shareholder rewards.
NextEra Energy has demonstrated remarkable consistency in its dividend payments, making it a reliable choice for income-focused investors. The company has increased its dividend for over 25 consecutive years, reflecting strong earnings growth and disciplined financial management. Even during economic downturns and market volatility, NextEra has continued to raise its payouts, reinforcing its commitment to returning value to shareholders. This level of consistency is a positive sign, as it indicates that the company generates stable cash flows and prioritizes rewarding long-term investors while continuing to invest in its renewable energy expansion. However, as can be seen in illustration 14, despite the dividend payout increasing, the dividend yield has been on a steady decline.
While NextEra’s dividend yield of around 2.2% (as of 2025) may not be the highest in the utility sector, it remains a reliable source of income, especially when combined with the company’s long-term growth prospects in renewable energy. For investors seeking a mix of dividend income and exposure to clean energy, NextEra presents a compelling case. However, given its high debt levels and capital-intensive business model, investors should monitor whether the company can sustain its dividend growth while continuing to invest in future expansion.
To summarize:
✅Green Flag:
Consistent Dividend Growth: NextEra has a strong history of dividend increases, making it a solid choice for income investors.
Balanced Strategy: The company provides both income and long-term growth potential, appealing to a broad range of investors.
Moderate Yield: While NextEra pays dividends, its yield is lower than some traditional utility stocks.
Insider Trading
Illustration 14: Recent Insider Selling for NextEra Energy
A crucial metric to consider when evaluating whether a company is worth investing in is insider trading activity—specifically, whether company insiders have been buying or selling shares over the past year. It’s particularly important to assess who has been trading, as directors should be monitored even more closely than officers.
As can be seen from the table above, there has been no selling by any mayor insiders recently. The insiders who have been selling stock has been lower level officers and directors of subsidiaries. This is a green flag for investors since it shows that insiders are confident in the company as they have not sold their shares.
Other Company Info
As illustrated below, NextEra Energy currently employs approximately 16,800 individuals, reflecting a steady increase from 14,900 employees in 2020. The company was originally founded in 1925 as Florida Power & Light Company and later rebranded as NextEra Energy in 2010 to reflect its expansion into renewable energy. It is publicly traded on the New York Stock Exchange under the ticker symbol NEE. Operating within the Utilities sector, NextEra Energy is classified under the Electric Utilities industry. The company has approximately 2.06 billion shares outstanding and a market capitalization of around $120 billion USD as of 2024.
Headquartered at 700 Universe Boulevard, Juno Beach, Florida 33408, United States, NextEra Energy’s official website is www.nexteraenergy.com.
Illustration 15-17: : Number of employees at NextEra Energy and its location in Juno Beach, Florida.
Final Verdict
NextEra Energy offers a compelling opportunity for investors seeking exposure to renewable energy, particularly wind and solar power, as well as energy storage solutions. The company has secured significant contracts with major corporations like Google and Walmart and continues to expand its clean energy initiatives. With a strong focus on sustainability and innovation, NextEra is well-positioned to capitalize on the increasing demand for carbon-free energy and play a leading role in the transition to a greener economy.
However, while NextEra Energy has experienced strong growth, there are some concerns related to its financial performance. Despite increasing revenue, high capital expenditures and significant debt levels to fund its renewable energy projects have put pressure on profitability. Additionally, the company’s cost of sales (COGS) remains substantial, impacting margins. While NextEra has maintained a stable dividend and solid market position, its reliance on debt and ongoing capital investment may raise concerns for some investors.
That said, it is important to note that NextEra Energy is a leader in the renewable energy space and is poised for long-term growth given the ongoing expansion of clean energy infrastructure. For growth-oriented investors who believe in the future of renewable energy and are willing to accept potential short-term financial volatility, NextEra presents a strong investment opportunity. However, for more conservative investors seeking a company with consistent profitability and low financial risk, NextEra Energy may not be the ideal choice.
Canadian Solar Inc. is one of the largest and most established solar energy companies in the world. It has made significant contributions to the global transition toward renewable energy, specifically solar power. With a presence in over 20 countries, Canadian Solar has successfully integrated itself into both the manufacturing of solar photovoltaic (PV) products and the development of solar projects. In this article, we will explore the history, operations, competitive positioning, financials, the future prospects of Canadian Solar and of course make a comprehensive analysis of the stock of Canadian Solar.
History and Founding
Canadian Solar was founded in 2001 by Dr. Shawn Qu, a former University of Toronto researcher with a background in electrical engineering. Dr. Qu, originally from China, started the company in Ontario, Canada, with the goal of providing high-performance solar modules at competitive prices. The company’s initial focus was on manufacturing solar cells and modules, and its breakthrough came with its focus on high efficiency and the development of advanced technologies in the solar industry.
The decision to base the company in Canada was a strategic move, given the country’s growing interest in clean energy and environmental sustainability. However, Canadian Solar’s roots were international, as Dr. Qu leveraged relationships in China for access to affordable manufacturing resources. The company quickly expanded from its Canadian base and set up large-scale manufacturing operations in China, where it remains one of the leading solar module manufacturers today.
Canadian Solar’s commitment to innovation and sustainability has allowed it to grow from a small, niche manufacturer to a global leader in solar energy. The company’s products are now used in residential, commercial, and utility-scale solar projects around the world, making Canadian Solar a key player in the global energy transition.
Illustration 1: Canadian Solar logo with sun and rays symbolizing commitment to solar power.
Operations and Products
Canadian Solar operates in two major segments: Solar Module Manufacturing and Solar Power Projects.
Solar Module Manufacturing Canadian Solar produces a wide range of photovoltaic (PV) products, including solar modules, inverters, and energy storage systems. Their solar panels are among the most efficient on the market, with varying products designed for different types of consumers, ranging from residential to large-scale commercial and utility installations. The company uses advanced technology such as PERC (Passivated Emitter and Rear Cell) to ensure high efficiency and durability of their modules.
Solar Power Projects Beyond manufacturing, Canadian Solar is actively involved in the development, financing, and operation of solar power projects globally. This segment includes utility-scale solar farms, distributed solar energy systems for commercial and industrial clients, and energy storage solutions.
Canadian Solar has completed over 10 GW of solar projects worldwide, cementing its position as a leading solar energy provider. The company focuses on end-to-end solar solutions, offering customers everything from project development to system integration, operation, and maintenance.
In addition to these, Canadian Solar has made significant strides in the energy storage market. As the world shifts towards renewable energy, energy storage solutions are seen as a key enabler for balancing intermittent power generation from solar and wind energy. Canadian Solar’s energy storage division, which works in tandem with their solar projects, provides customers with grid-independent solutions that help store excess energy for later use.
Revenue Breakdown
The revenue breakdown of Canadian Solar is as follows:
1. Solar Module Manufacturing: This segment represents the largest portion of Canadian Solar’s revenue, contributing approximately 60-70%. The company’s solar modules are sold to both residential and commercial customers and are used in utility-scale projects. This portion of the business continues to grow as demand for solar energy increases globally, driven by favorable government policies, falling solar costs, and rising environmental concerns.
2. Solar Power Projects: The company’s solar power projects segment accounts for around 25-35% of its revenue. This portion includes the sale of solar power plants, as well as ongoing income generated from the operation of these plants. Over the years, Canadian Solar has managed to increase its share of revenue from projects, reflecting the growing demand for large-scale solar farms and distributed generation systems.
3. Energy Storage and Other Products: Although a smaller segment, energy storage systems and other ancillary products are becoming an increasingly important part of Canadian Solar’s portfolio. This segment contributes roughly 5-10% of the company’s total revenue.
Illustration 2: Energy Storage is quickly becoming a growing sector for Canadian Solar.
Canadian Solar has also been successful in managing costs and improving operational efficiency. The company’s gross margin has steadily improved due to its focus on high-efficiency products and scaling its manufacturing operations.
Key Competitors
Canadian Solar operates in a very highly competitive market. Its key competitors include:
First Solar (FSLR): A US-based solar energy company, First Solar is one of the leading manufacturers of thin-film solar modules. Unlike Canadian Solar, which primarily produces crystalline silicon modules, First Solar specializes in cadmium telluride (CdTe) technology. First Solar is known for its utility-scale solar projects, similar to Canadian Solar’s project development segment.
JinkoSolar (JKS): Another Chinese solar giant, JinkoSolar is one of the largest manufacturers of solar panels globally. JinkoSolar’s strength lies in its focus on technology, with an emphasis on increasing panel efficiency and reducing costs. The company’s global footprint is comparable to Canadian Solar’s, and its competitive pricing makes it a formidable rival.
Trina Solar (TSL): Trina Solar is another major Chinese player in the solar market. Like Canadian Solar, it operates in both module manufacturing and project development. Trina Solar has a strong presence in Europe, the Americas, and Asia.
LONGi Green Energy (601012.SS): LONGi is one of the largest manufacturers of monocrystalline silicon solar products. With a focus on technology and efficiency, LONGi competes directly with Canadian Solar in the module manufacturing market.
SunPower (SPWR): Based in the United States, SunPower is a major player in both residential and commercial solar installations. SunPower differentiates itself by offering premium solar products, while Canadian Solar offers a broader range of modules for different market segments.
To sum up, the solar power market is highly competitive with many competitors to challenge Canadian Solar.
Market Position and Competitive Advantages
Despite very high competion Canadian Solar holds a competitive edge in several areas:
Global Reach: With manufacturing facilities in China, Canada, and other parts of the world, Canadian Solar has a robust global supply chain and can cater to customers in diverse markets. Its presence in the Americas, Europe, and Asia ensures that it remains competitive in the global solar market.
Innovation and Technology: Canadian Solar places a strong emphasis on research and development (R&D). The company consistently strives to improve the efficiency and durability of its solar panels, which has helped it maintain its competitive edge. Canadian Solar is at the forefront of solar cell and panel technology, incorporating advanced technologies like PERC and bifacial modules.
Illustration 3: Canadian Solar’s is well known for being invested in research and development.
Cost Leadership: One of the key drivers behind Canadian Solar’s success is its ability to maintain a competitive price point while offering high-quality products. By leveraging economies of scale and low-cost manufacturing in China, Canadian Solar can keep its prices lower than many competitors while maintaining margins.
Comprehensive Solutions: Unlike some competitors that focus primarily on module manufacturing, Canadian Solar offers a comprehensive solution, including project development and energy storage. This ability to offer turnkey solutions, from manufacturing to operation and maintenance, is a significant advantage in attracting large-scale customers.
Future Outlook
Looking ahead, Canadian Solar is well-positioned to continue its growth. The global transition to renewable energy is accelerating, with solar energy at the forefront. The company’s strong brand, technological innovation, and global footprint provide a solid foundation for its future growth. Canadian Solar is also well-positioned to benefit from government incentives and policies aimed at promoting renewable energy adoption.
With increasing demand for solar energy, growing interest in energy storage, and continued advancements in panel technology, Canadian Solar is expected to remain a leader in the solar industry.
Furthermore, the company’s expansion into emerging markets like India, Africa, and Latin America presents significant growth opportunities.
Stock Analysis
In this section we will analyze Canadian Solar’s stock to see if it is a good stock to buy or not. Our philosophy is value investing meaning that we try to find good quality companies that are undervalued. However, we will give a holistic overview so all kind of investors with different philosophies can judge the stock for themselves.
Revenue and Profits
To determine a company’s worth and if it is worth investing in, the company’s revenue and profits are a natural starting point to analyze. It should never bee forgotten that a stock represents a company just like the small businesses in your home town. If someone asked you if you want to buy their company, the first question would naturally be how much the company makes and the same question when trying to analyze if a company registered in the stock exchange is worth buying.
Illustration 4 and 5: Revenue of Canadian Solar from 2009 to 2023.
As seen in Illustrations 4 and 5, Canadian Solar’s revenue has been increasing over the long term, particularly in recent years. This growth is driven by rising global demand for solar energy, increased module shipments, and expansion into energy storage and project development. Additionally, favorable government policies and renewable energy commitments continue to fuel sales, positioning the company for sustained growth.
However, despite this overall upward trend, Canadian Solar’s revenue growth has been inconsistent. As shown in Illustrations 4 and 5, there have been years—such as 2012, 2016, and 2019—where revenue declined. This volatility is partly due to intense competition in the solar industry, fluctuating market conditions, and policy shifts affecting demand. For investors, this inconsistency raises concerns, as it suggests that Canadian Solar may not deliver steady revenue growth year after year, making it a potentially riskier investment compared to companies with more predictable financial performance.
Even though revenue growth has been inconsistent, the long-term trend remains upward. Considering the rising global demand for energy, the increasing popularity of solar power, and the momentum of the green energy transition, Canadian Solar is well-positioned for future growth. These factors, combined with the company’s expanding product offerings and global presence, suggest a promising outlook despite short-term volatility.
Illustration 6 and 7: Net Income of Canadian Solar from 2009 to 2023.
Net income is a crucial metric to evaluate when determining whether a company is a worthwhile investment. It represents a company’s net profit or loss after accounting for all revenues, income items, and expenses, calculated as Net Income = Revenue – Expenses.
As seen in Illustrations 6 and 7, Canadian Solar’s net profit has shown a slight upward trend but has mostly remained relatively flat with fluctuations since 2014, peaking around 250. This inconsistency is a red flag for potential investors, as it indicates that despite growing revenue, the company has struggled to achieve steady profit growth. Factors such as pricing pressure, industry competition, and fluctuating costs may be limiting profitability, making it difficult for investors to rely on sustained earnings growth. When investing in a company, increasing profits is one of the most—if not the most—important factors for investors. However, Canadian Solar has struggled to achieve consistent profitability, as its net income has remained relatively stable over the years despite growing revenue. This lack of sustained profit growth raises concerns about the company’s ability to improve margins and generate higher returns for shareholders in the long run.
Revenue breakdown
Illustration 8: Revenue Breakdown for Canadian Solar
As seen in Illustration 8, Canadian Solar is a pure-play solar energy company, generating all its revenue from the solar industry. This makes it an ideal investment opportunity for those seeking direct exposure to the solar sector. However, for investors looking for diversification within the broader utility sector, Canadian Solar may not be the best fit, as it lacks revenue streams from other energy sources or utility-related businesses.
Additionally, Illustration 8 highlights that the cost of sales in the solar energy industry is significantly high, which consumes a large portion of Canadian Solar’s revenue. On top of that, the company allocates substantial funds toward R&D, administration, and marketing, further limiting its net profit. As a result, despite strong revenue figures, the company’s actual profitability remains relatively low, which could be a concern for investors focused on earnings growth.
Earnings per shar (EPS)
Earnings Per Share (EPS) is a key financial metric that measures a company’s profitability on a per-share basis. It indicates how much profit a company generates for each outstanding share of its stock, and is used o assess a company’s financial health, profitability, and potential for growth. In other words this metric can tell us how profitable the business is,
Illustration 9: Earnings per share for Canadian Solar from 2009 to 2023.
The EPS figure itself isn’t the primary focus for value investors—it can be 0.2 or 10, but what truly matters is the company’s ability to generate consistent earnings growth. A steadily increasing EPS over time signals strong financial health, profitability, and long-term value creation.
Canadian Solar’s earnings per share (EPS) performance from 2009 to 2023 presents a mixed picture for investors. While the company has demonstrated resilience and growth in revenue over the long term, its EPS has been highly volatile, with significant fluctuations rather than a consistent upward trend. Periods of strong earnings, such as in 2014, have been followed by years of weaker performance, making it difficult for investors to predict steady profit growth. This inconsistency can be a red flag for long-term investors who prioritize stable and growing earnings, as it suggests that Canadian Solar’s profitability is sensitive to external factors like pricing pressure, raw material costs, and government policies.
Assets and Liabilities
Illustration 10 and 11: Assets, Liabilities and Total Shareholder Equity for Canadian Solar from 2009 to 2023.
When evaluating a company as a potential investment, understanding its assets and liabilities is crucial. If a local business owner offered to sell their shop to you, one of the first questions—after determining its profitability—would be about its equity and assets. The same principle applies when assessing publicly traded companies like Dominion Energy.
As shown in Illustrations 10 and 11, Canadian Solar has a substantial asset base, totaling $11.9 billion in 2024. This steady asset growth over time is a positive sign, indicating that the company is expanding its operations, investing in new technologies, and strengthening its market position. A growing asset base often reflects a company’s ability to scale its business, acquire new projects, and improve its production capacity, which is particularly important in the highly competitive solar energy industry.
At the same time, Canadian Solar’s total liabilities have also increased significantly, rising from $573 million in 2009 to $8.2 billion in 2024. While such a sharp increase in debt might raise concerns for some investors, it is not necessarily a red flag given the nature of the solar energy business. Solar companies typically operate in a capital-intensive environment where they must secure substantial financing to fund large-scale projects, develop infrastructure, and maintain their competitive edge. Debt financing is often necessary for expanding solar farms, increasing manufacturing capacity, and advancing energy storage solutions, all of which contribute to long-term growth.
The key factor for investors is whether Canadian Solar can effectively manage its debt while maintaining strong revenue and profitability. If the company can generate consistent cash flow and sustain high demand for its products and services, its rising liabilities may not be a major issue. However, if debt levels continue to grow faster than revenue or profits, it could indicate financial strain, making it important for investors to monitor the company’s ability to service its obligations while maintaining profitability.
The cash on hand for Canadian Solar is a green flag for potential investors, as the company has $2.9 billion in readily available cash as of 2023. This strong cash reserve provides the company with flexibility and liquidity, enabling it to navigate market fluctuations, invest in new projects, and meet its short-term financial obligations without relying heavily on external financing.
Additionally, Canadian Solar’s long-term debt of $1.65 billion in 2023 is significantly lower than its available cash, which is a positive sign for investors. This indicates that the company has a solid financial cushion and is not overly reliant on debt to fund its operations. It suggests that Canadian Solar is in a strong position to manage its liabilities, fund future growth, and weather economic downturns without significant financial strain. This balance between cash and debt is reassuring for investors, as it reflects financial stability and prudent management of resources.
As seen in Illustration 11, Total Shareholder Equity—calculated as total assets minus total liabilities—has consistently grown over the past 14 years. This is a positive indicator for potential investors, as it suggests that Canadian Solar is building value over time rather than eroding its financial foundation. A steadily increasing shareholder equity indicates that the company’s assets are growing at a faster rate than its liabilities, which is a green flag for financial health. This trend suggests that Canadian Solar is successfully expanding its operations while maintaining a solid balance sheet. Additionally, rising equity provides a buffer against financial downturns, making the company more resilient in times of economic uncertainty. However, investors should also consider how this growth is achieved—whether through profitable operations or increased debt financing—to fully assess the sustainability of this trend.
Debt to Equity Ratio
Illustration 12 and 13: The Debt to Equity ratio of Canadian Solar from 2009 to 2024.
The Debt-to-Equity (D/E) ratio is an important financial metric for assessing Canadian Solar’s financial leverage and risk. It compares the amount of debt the company uses to finance its operations relative to its shareholder equity. A high D/E ratio suggests that the company relies more heavily on debt to fuel growth, which could increase financial risk, especially during economic downturns when managing debt obligations becomes more challenging. In contrast, a lower D/E ratio indicates that Canadian Solar is primarily financed through equity, reducing financial risk but potentially limiting its ability to rapidly expand.
In recent years, Canadian Solar has maintained a relatively high D/E ratio, reflecting its reliance on both debt and equity financing to support its operations. This is typical for companies in the solar industry, as they often need to take on debt to fund large-scale projects, infrastructure, and expansion into new areas like energy storage. However, while leveraging debt is common in the sector, investors should remain cautious and monitor Canadian Solar’s ability to manage its increasing debt load. A high D/E ratio, particularly during periods of rising interest rates or market volatility, can place pressure on profitability and financial stability.
As of 2023, Canadian Solar’s D/E ratio reached nearly 6, and it was also high in 2016 and 2017, exceeding 5. While the company has made strides in reducing its debt and increasing equity over time, its D/E ratio remains substantially higher than the level recommended by investors like Warren Buffett, who prefers a ratio below 0.5. This suggests that while the company has made progress, Canadian Solar still carries a significant debt burden that investors should carefully assess to ensure it does not hinder long-term growth or financial health.
Price to earnings ratio (P/E)
Illustration 14 and 15: The price to earning ratio for Canadian Solar from 2010 to 2024. The P/E ratio was negative and/or not available for 2012 and 2013.
For value investors, one of the most critical metrics when evaluating Canadian Solar’s stock is the price-to-earnings (P/E) ratio, as it helps assess whether the company is undervalued or overvalued. Even if a company has strong financials, purchasing its stock at a high price can lead to poor returns. For example, imagine a business generating solid profits of $1 million per year. If the owner offers to sell you the business for just $1, it would be an incredible deal. But if the owner asks for $1 trillion, even though the business is profitable, the price would be absurdly overvalued. The stock market works similarly—companies can be priced cheaply on some days and excessively expensive on others.
Warren Buffett, a legendary value investor, typically considers stocks with a P/E ratio of 15 or lower as “bargains.” A high P/E ratio suggests that investors are paying a premium for the company’s earnings, expecting significant growth. However, this also indicates that the stock is expensive relative to its earnings, which can be a red flag for value investors. Canadian Solar’s P/E ratio has fluctuated widely over the years. For example, it was in bargain territory at 4.93 in 2011, before reaching a strongly overpriced level of 62.2 in 2021. However, with the current P/E ratio of 29.90 at 16 February 2025, Canadian Solar’s stock can be seen as fairly priced, meaning it is neither undervalued nor an ideal investment for value investors seeking a strong bargain.
The strongly fluctuating prices for Canadian Solar indicates that the company’s stock price is volatile relative to its earnings, and signal uncertainty in the market or changing investor expectations about future growth. For potential investors the fluctuating prices gives them the opportunity to buy the stock at bargain price, but they should be very careful not buy at the top.
Dividend
Canadian Solar does not currently offer a dividend, focusing instead on reinvesting its profits into growth initiatives, including expanding solar projects and developing energy storage solutions. This approach is common for growth-focused companies, especially in the renewable energy sector, where significant capital is needed for expansion.
While Canadian Solar doesn’t provide regular income through dividends, its strategy of reinvestment can be appealing to growth investors looking for long-term capital appreciation rather than immediate returns. However, the lack of dividends may be a red flag for income-focused investors who rely on steady income from their investments. This strategy could also limit some investor interest, especially those seeking consistent payouts.
To summarize:
✅ Green Flag:
Growth Potential: By reinvesting profits, Canadian Solar is positioning itself for long-term growth in the rapidly expanding solar and renewable energy sectors.
Capital Allocation: The company prioritizes strategic investments in projects and innovation over dividend payouts.
🚩 Red Flag:
No Dividend: The lack of dividends may deter income-seeking investors, as Canadian Solar reinvests all profits rather than distributing earnings to shareholders.
Insider Trading
A key metric to consider when evaluating Canadian Solar as an investment isinsider trading activity, specifically whether company insiders have been buying or selling shares in the past year. It’s important to focus on who is making these transactions, with particular attention to directors, as their actions often provide more insight into the company’s future prospects than those of officers.
As shown in recent data, there has been no insider selling at Canadian Solar. This is a green flag for investors, as it suggests that insiders have confidence in the company’s future performance and are holding on to their shares, rather than liquidating them.
Other Company info
As of the latest data, Canadian Solar employs approximately 22,200 people, reflecting steady growth from around 8,700 employees in 2014. The company was founded in 2001 and is headquartered in Ontario, Canada. It is listed on the NASDAQ exchange under the ticker CSIQ and operates within the Solar Energy industry under the broader Renewable Energy sector. Canadian Solar currently has approximately 73.3 million shares outstanding and a market capitalization of around USD 4.58 billion.
The company’s corporate headquarters is located at 545 Speedvale Avenue West, Guelph, Ontario N1K 1E6, Canada. For more information, you can visit their official website at www.canadiansolar.com.
Illustration 16-18: Number of employees at Canadian Solar and its location in Ontario, Canada.
Canadian Solar presents a promising long-term opportunity, particularly for investors interested in the renewable energy sector. The company is making significant strides in solar energy, energy storage, and utility-scale projects, positioning itself well for the growing demand for sustainable energy solutions. However, its financial health warrants careful consideration.
Although Canadian Solar has a solid asset base, its rising debt levels and increasing liabilities each year contribute to heightened financial risk. A significant portion of its revenue is consumed by costs of goods sold and operating expenses, limiting its profitability. As a result, while Canadian Solar has shown growth, its profitability has been inconsistent, and some of its expansion plans have not met expectations.
From a value investing standpoint, Canadian Solar does not appear to be undervalued, which may make it less appealing for investors seeking stocks with strong financials available at a discount. While the company holds substantial growth potential in the renewable energy sector, it’s crucial for investors to consider the associated risks, especially given its financial structure and profitability challenges. A key concern is that despite the increase in revenue, Canadian Solar’s net profit has remained stagnant, signaling potential inefficiencies or other underlying issues that may affect future profitability. Given these factors, our recommendation is to proceed with caution. If you find our analysis valuable, consider subscribing by entering your email below.
Constellation Energy Corporation stands as a prominent American energy company specializing in electric power, natural gas, and energy management services. Serving approximately two million customers across the continental United States, Constellation has solidified its position as a key player in the nation’s energy sector.
Company History
The origins of Constellation Energy trace back to 1999 when Baltimore Gas and Electric Company (BGE) established it as a holding company. Over the years, Constellation expanded its operations, becoming a Fortune 500 company and one of the largest electricity producers in the United States. In 2012, a significant merger with Exelon Corporation occurred, leading to the rebranding of its energy supply business as Constellation, an Exelon company. This merger integrated Constellation’s extensive energy production capabilities with Exelon’s resources, enhancing its market presence.
A decade later, in 2022, Constellation Energy was spun off from Exelon, reestablishing itself as an independent entity. Former subsidiary Baltimore Gas & Electric remained part of Exelon. Since becoming independent, Constellation has grown and made headlines by, in September 2024, entering into a contract with Microsoft to restart the undamaged nuclear reactor at the Three Mile Island plant. The company is also planning to upgrade other existing reactor plants to provide more power.
In January 2025, Constellation agreed to acquire the natural gas and geothermal power provider Calpine for $16.4 billion ($26.6bn including debt) in a cash-and-stock deal. Approval of the purchase by state and federal regulators will be necessary.
Operations and Business Overview
Constellation Energy operates a diverse portfolio of energy assets, encompassing nuclear, natural gas, wind, solar, and hydroelectric power. With a total capacity of approximately 32,400 megawatts, the company generates enough energy to power 16 million homes and businesses. Notably, Constellation is the nation’s largest producer of carbon-free energy, contributing to 10% of all clean power on the U.S. grid. This diverse energy mix not only ensures reliability but also underscores the company’s commitment to sustainability.
Illustration 1: Constellation Energy logo symbolizing energy flow and commitment to sustainability.
Constellation Energy’s operation currently includes natural gas, nuclear energy, wind energy, hydro energy and solar energy. The company will probably also het into geothermal power after the aquisition of Calpine.
Customer Base and Energy Supply
Constellation Energy serves a wide range of customers, from residential users to large industrial corporations and government entities. Many Fortune 500 companies, including Amazon, Microsoft, and McDonald’s, have signed long-term power agreements with Constellation to secure 100% renewable energy for their operations.
Illustration 2: Constellation Energy Generating Cpacity breakdown
The largest energy source for Constellation in Nuclear energy. Constellation Energy is the largest producer of carbon-free electricity in the U.S., with 23 nuclear reactors across 14 sites producing about 21,000 megawatts (MW) of clean energy. Constellation’s nuclear fleet is primarily located in Illinois, Maryland, New York, and Pennsylvania. The company has heavily invested in extending the life of existing nuclear plants and is exploring small modular reactors (SMRs) as part of its future strategy. The company has heavily invested in extending the life of existing nuclear plants and is exploring small modular reactors (SMRs) as part of its future strategy.
While Constellation focuses on clean energy, natural gas-fired power plants remain an important part of its operations. The company has 6,000+ MW of natural gas capacity, making it one of the largest gas-fired power producers in the country, and it is its second largest energy source at the moment.
As part of its clean energy initiative, Constellation operates multiple large-scale wind and solar farms across the U.S. Constellation Energy also operates hydroelectric power plants, although this segment represents a smaller portion of its total energy mix.
Competitors and Competitive Advantage
In the competitive energy market, Constellation Energy faces competition from major providers such as Duke Energy, NextEra Energy, and Southern Company. Constellation’s competitive advantage lies in its diverse energy mix, substantial carbon-free energy production, and strategic partnerships. The company’s focus on renewable energy and innovative solutions positions it well to meet the evolving demands of the energy market.
Illustration 3: Constellation Energy is a big player in the Nuclear Energy Market
One of Constellation’s major competitive advantages is its nuclear energy infrastructure, which ensures stable, 24/7 clean energy compared to intermittent renewables like wind and solar. The company has also secured long-term energy contracts with major corporations like Amazon, Microsoft, and McDonald’s, providing a steady revenue stream. Additionally, Constellation is investing in carbon capture technology, hydrogen development, and smart grid innovations to stay ahead in the clean energy transition.
Community Engagement
Beyond its business operations, Constellation is deeply involved in community initiatives. The company ranks second in local corporate giving among Baltimore-based companies, donating $7.10 million in 2017. Additionally, Constellation provides grants to local schools that implement education programs promoting science and technology, reflecting its commitment to fostering education and community development.
Stock Analysis
Revenue and Profit
To assess a company’s true value and investment potential, analyzing its revenue and profits is a fundamental first step. It’s important to remember that a stock represents ownership in a real business, much like the small companies in your local community. If a small business owner approached you with an offer to buy their company, your first questions would likely be: “What’s the price?” and “How much does the company generate in revenue and profit each year?”
Beyond just current earnings, it’s crucial to examine the company’s financial performance over time. This helps determine whether recent profits are part of a consistent upward trend, or if they are temporary spikes or part of a larger decline. A long-term perspective ensures that an investment is based on sustainable growth rather than short-term fluctuations.
Illustration 4 and 5: Revenue of Constellation Energy from 2019 to 2023. Due to Constellation becoming an independent company from Exelon first in 2022, numbers for Constellation Energy is not available before 2019.
As illustrated in Figures 4 and 5, Constellation Energy’s revenue has shown a steady upward trend over the past five years. While this may not provide a long-term dataset for deep historical analysis, the consistent growth in revenue is a positive indicator that should not be overlooked by investors. A steadily increasing revenue stream suggests strong demand, effective business operations, and potential for future profitability. Moreover, this trend signals that the company is successfully expanding its market presence and capitalizing on industry growth opportunities, making it a promising prospect for long-term investors.
Revenue breakdown
Illustration 6: Revenue breakdown of Constellation Energy gathered from gurufocus.
As shown in Illustration 6, Constellation Energy’s revenue comes from a diverse range of sources, which is a positive sign for investors. A diversified revenue stream indicates that the company is not overly reliant on any single source of income, reducing risk and providing stability. However, it’s important to note that the company’s COGS (Cost of Goods Sold) eats up a significant portion of its revenue. This is a negative aspect, as high operating costs, particularly related to fuel and maintenance, eat into profitability. While it is common in the energy sector, the substantial impact of these costs means that a large chunk of revenue is absorbed by expenses, limiting the company’s ability to generate higher profits.
Net Income
Illustration 7 and 8: Net Income of Constellation Energy for the past five years. Due to Constellation becoming an independent company from Exelon first in 2022, numbers for Constellation Energy is not available before 2019.
Net income is a crucial metric to evaluate when determining whether a company is a worthwhile investment. It represents a company’s net profit or loss after accounting for all revenues, income items, and expenses, calculated as Net Income = Revenue – Expenses.
The Net Income of Constellation Energy raises a red flag, as it has not only remained at a low level but has also been negative at times, meaning the company’s expenses have exceeded its revenue. This suggests that Constellation has been operating at a loss in certain periods, which is concerning for potential investors. Negative net income indicates that the company is struggling to control costs or increase profitability, which could raise doubts about its financial health and ability to generate sustainable returns. It is crucial for investors to carefully monitor this trend, as ongoing losses could signal deeper operational or strategic issues that need to be addressed.
Earnings per Share (EPS)
Illustration 9: Earnings per share for Constellation Energy from 2019 to 2013. Due to Constellation becoming an independent company from Exelon first in 2022, numbers for Constellation Energy is not available before 2019.
Earnings Per Share (EPS) is a key financial metric that measures a company’s profitability on a per-share basis. It indicates how much profit a company generates for each outstanding share of its stock, and is used o assess a company’s financial health, profitability, and potential for growth. In other words this metric can tell us how profitable the business is. The EPS figure itself isn’t the primary focus for value investors—it can be 0.2 or 10, but what truly matters is the price-to-earnings (P/E) ratio and the company’s ability to generate consistent earnings growth. A steadily increasing EPS over time signals strong financial health, profitability, and long-term value creation.
For Constellation Energy, its EPS performance raises concerns, making it more of a red flag than a green one. Over the past few years, Constellation’s EPS has been inconsistent, with periods of negative earnings, indicating that the company has struggled with profitability. A fluctuating or negative EPS is a warning sign for investors, as it suggests unstable earnings and financial uncertainty. Ideally, long-term investors look for companies with a steadily growing EPS, as this signals strong financial health and increasing shareholder value—something Constellation has yet to demonstrate consistently.
Additionally, because Constellation operates in the capital-intensive energy sector, high costs related to fuel, maintenance, and infrastructure investments eat into its profits, making it difficult to maintain a strong EPS. Unless the company significantly improves its profitability, reduces its cost structure, or benefits from external factors like rising electricity prices, its EPS will remain a concern for investors looking for stability and long-term growth. While Constellation Energy has potential in the clean energy sector, its EPS performance suggests higher risk, making it less attractive for conservative, value-focused investors.
Assets and Liabilities
Illustration 10 and 11: Assets and Liabilities of Constellation Energy from 2019 to 2023. ue to Constellation becoming an independent company from Exelon first in 2022, numbers for Constellation Energy is not available before 2019.
When evaluating a company as a potential investment, understanding its assets and liabilities is crucial. If a local businesses offered to sell their shop to you —after determining revenue and profit—you would be asking about the business’s debt and the value of its assets. The same principle applies when assessing publicly traded companies like Constellation Energy.
The company’s assets have remained consistently high, fluctuating between $48-50 billion USD, which is a positive sign of financial stability. Notably, its total assets exceed its liabilities and debt, indicating a strong financial position and overall good financial health. This is generally a green flag for investors, as it suggests the company has a solid foundation to support its operations.
However, as illustrated in Figure 10, a concerning trend has emerged. Over the past five years, total liabilities and debt have steadily increased, while the company’s assets have remained stagnant. This shift is a negative signal, as it suggests that the company’s financial position has weakened over time. An increasing debt burden without corresponding asset growth raises questions about how efficiently the company is managing its finances and whether it is taking on too much risk.
Additionally, Constellation Energy’s cash on hand is at a worryingly low level, especially when compared to its rising debt. This is a red flag, as it indicates the company may not be adequately prepared to handle financial downturns, unexpected expenses, or economic uncertainties. A low cash reserve limits flexibility and could force the company to take on more debt or issue new shares in difficult times, potentially diluting shareholder value.
While the company remains financially stable for now, investors should closely monitor its rising debt levels and limited cash reserves, as these factors could impact long-term financial sustainability and overall risk exposure. The most important indicator when assessing a company’s financial health is Total Shareholder Equity, which is calculated as: Total Shareholder Equity=Total Assets−Total Liabilities. As can be seen from illustration 11, its total shareholder equity has gradually decreased because of rising liabiltities something that is a red flag for potential investors and should be closely monitored.
Debt to Equity Ratio
Illustration 12: The Debt to Equity Ratio of Constellation Energy from 2019 to 2014.
The Debt-to-Equity (D/E) ratio is a key financial metric used to assess a company’s financial leverage and risk. It measures how much debt a company uses to finance its operations relative to shareholder equity. A high D/E ratio (greater than 1.0) suggests that the company relies heavily on debt financing, which can amplify financial risk, particularly during economic downturns when debt obligations may become more difficult to manage. In contrast, a low D/E ratio (below 1.0) indicates that the company is primarily financed through equity rather than debt, reducing financial risk but potentially limiting rapid expansion. A negative D/E ratio, on the other hand, signals that a company has more liabilities than equity—often considered a warning sign for investors.
Constellation Energy has a high D/E which was 3.5 in 2024, and has generally been over 3 the past 5 years which is a very high level. Constellation Energy’s D/E ratio has remained at an elevated level, meaning that the company is more dependent on debt financing rather than funding growth through retained earnings or equity. This is particularly concerning because rising interest rates and economic downturns could make it harder for the company to manage its debt burden. If Constellation continues to accumulate liabilities while its equity remains stagnant or grows at a slower pace, it could lead to higher financial strain and potential difficulties in meeting debt obligations.
A high D/E ratio is not unusual for utility companies, as they often require significant capital investment for infrastructure, maintenance, and expansion. However, when compared to competitors, Constellation’s debt levels are on the higher side, making it a riskier choice for conservative investors.
Price to earnings ratio (P/E)
Illustration 13 and 14: P/E ratio for Constellation Energy from 2019 to 2025. The P/E ratio was negative for 2021 and 2022 as the EPS was negative.
For value investors, the most important metric when evaluating a stock is the price-to-earnings (P/E) ratio, which helps determine whether a company is undervalued or overvalued. if a company has outstanding financials, buying its stock at an excessively high price can lead to poor returns. To illustrate this, imagine a local barber shop that generates solid profits. If the owner offers to sell you the business for $1, it would be an incredible dery al. However, if he tries to sell it for $1 billion, no matter how successful the shop is, the price would be absurdly overvalued. The stock market operates in a similar way—companies can be cheaply priced on some days and highly expensive on others.
In the past couple of years the P/E ratio of Constellation has been around 23-24 which is average and suggest that the company is neither undervalued nor overvalued. However, the P/E ratio of 33,77 in January 2025 can be considered high. A high P/E ratio suggests that the company’s stock is priced at a premium relative to its earnings, indicating that investors expect substantial future growth. However, such expectations may not align with the company’s actual performance, especially considering Constellation Energy’s recent financial challenges, including inconsistent earnings and rising debt levels. It’s also important to note that Constellation Energy’s P/E ratio has experienced considerable volatility. For instance, at the end of 2022, the company had a negative P/E ratio of -177, reflecting periods of negative earnings. The P/E is a negative flag and suggest that the price is too high for valueinvestors.
Dividend
The company follows a quarterly dividend payment schedule. For instance, in 2024, dividends of $0.3525 per share were declared in February, May, July, and November, with corresponding ex-dividend dates and payment dates in the subsequent months. This regularity provides investors with a predictable income stream.
Constellation Energy has demonstrated a consistent increase in its dividend payouts over the past few years. Here’s a summary of the annual dividends per share:
2024: $1.41
2023: $1.128
2022: $0.564
t’s important to note that Constellation Energy’s dividend yield remains relatively modest compared to industry averages. As of January 2025, the yield stands at 0.42%, which is lower than the typical yield for utility companies. The company’s dividend payout ratio stands at around 15.55%, suggesting that a modest portion of earnings is allocated to dividends, which may indicate potential for future increases.
In summary, Constellation Energy’s increasing dividends and consistent payment schedule are positive indicators for investors seeking stable returns. However, the yield is modest, and the company’s payout ratio is prudent. This reflects a strategy aimed at sustainable growth and financial stability, but is also bad news for dividend investors as the dividend for Constellation Energy is far lower compared to other utility companies and to the stock market as a whole.
Insider Trading
A crucial metric to consider when evaluating whether a company is worth investing in is insider trading activity—specifically, whether company insiders have been buying or selling shares over the past year. It’s particularly important to assess who has been trading, as directors should be monitored even more closely than officers.
As can be seen from the table below, there has been no selling by any insiders recently. This is a green flag for investors since it shows that insiders are confident in the company as they have not sold their shares.
Illustration 15: Most recent Constellation Energy Insider Trades
Other Company Info
As illustrated below, Constellation Energy currently employs approximately 13,871 individuals, reflecting a steady increase from 11,696 employees in 2021.The company was established in 1999 and, following a merger with Exelon in 2012, re-emerged as an independent entity in 2022 after a corporate spin-off. It is publicly traded on the NASDAQ stock exchange under the ticker symbol CEG. Operating within the Utilities sector, Constellation Energy is classified under the Multi-Utilities industry.The company has approximately 319 million shares outstanding and a market capitalization of around $95.453 billion USD.
Headquartered at 1310 Point Street, Baltimore, Maryland 21231, United States, Constellation Energy’s official website is http://www.constellationenergy.com.
Final Verdict
Constellation Energy offers an exciting opportunity for investors looking to gain exposure to nuclear and renewable energy. The company has secured high-profile business deals with Amazon and Microsoft and has contracts in place to expand its clean energy portfolio. With a strong commitment to sustainability and future-oriented investments, Constellation is well-positioned to benefit from the growing demand for carbon-free energy.
However, the company’s financial performance raises concerns. Both revenue and net income have fluctuated significantly over the past few years, and high COGS (Cost of Goods Sold) consumes a large portion of profits. Additionally, total shareholder equity has declined, as assets have remained stable while liabilities and debt have increased. These factors indicate potential financial instability and a lack of consistent profitability.
That said, it is crucial to consider that Constellation Energy only recently became an independent company, meaning the available financial data is somewhat limited. Moreover, rising liabilities are not uncommon for companies heavily investing in large-scale projects like nuclear and renewable energy. For growth-oriented investors who believe in the long-term potential of clean energy, Constellation Energy could be a compelling, albeit risky, investment. However, for value investors seeking a financially stable and undervalued company with strong past performance, Constellation Energy is not an ideal choice.
A dividend is the distribution of some of a company’s earnings to a class of its shareholders, as determined by the company’s board of directors. Common shareholders of dividend-paying companies are typically eligible as long as they own the stock before the ex-dividend date. Dividends may be paid out as cash or in the form of additional stock or other property. Along with companies, various mutual funds and exchange-traded funds (ETF) also pay dividends.
A dividend is a token reward paid to the shareholders for their investment in a company’s equity, and it usually originates from the company’s net profits. While the major portion of the profits is kept within the company as retained earnings–which represent the money to be used for the company’s ongoing and future business activities–the remainder can be allocated to the shareholders as a dividend. At times, companies may still make dividend payments even when they don’t make suitable profits. They may do so to maintain their established track record of making regular dividend payments.
The board of directors can choose to issue dividends over various time frames and with different payout rates. Dividends can be paid at a scheduled frequency, such as monthly, quarterly or annually.
Companies that pay dividends
Companies can also issue non-recurring special dividends either individually or in addition to a scheduled dividend. Backed by strong business performance and an improved financial outlook, for instance Microsoft Corp (MSFT) declared a special dividend of $3.00 per share in 2004, which was way above the usual quarterly dividends in the range of $0.08 to $0.16 per share.
Larger, more established companies with more predictable profits are often the best dividend payers. These companies tend to issue regular dividends because they seek to maximize shareholder wealth in ways aside from normal growth. Companies in the following industry sectors are observed to be maintaining a regular record of dividend payments: Basic materials, Oil and gas, Banks and financial, Healthcare and pharmaceuticals and Utilities. Companies structured as master limited partnership (MLP) and real estate investment trust (REIT) are also top dividend payers since their designations require specified distributions to shareholders.
Certain dividend-paying companies may go as far as establishing dividend payout targets, which are based on generated profits in a given year. For example, banks typically pay out a certain percentage of their profits in the form of cash dividends. If profits decline, dividend policy can be postponed to better times.
Start-ups and other high-growth companies, such as those in the technology or biotech sectors, may not offer regular dividends.
Because these companies may be in the early stages of development and may incur high costs (as well as losses) attributed to research and development, business expansion and operational activities, they may not have sufficient funds to issue dividends. Even profit-making early- to mid-stage companies avoid making dividend payments if they are aiming for higher-than-average growth and expansion, and want to invest their profits back into their business rather than paying dividends. The business growth cycle partially explains why growth firms do not pay dividends; they need these funds to expand their operations, build factories and increase their personnel.
Important Dividend Dates
Dividend payments follow a chronological order of events and the associated dates are important to determine the shareholders who qualify for receiving the dividend payment.
Announcement Date: Dividends are announced by company management on the announcement date, and must be approved by the shareholders before they can be paid. Any change in the expected dividend payment can cause the stock to rise or fall quickly as traders adjust to new expectations. The ex-dividend date and record date will occur after the declaration date. Once a dividend is declared on the announcement date, the company has a legal responsibility to pay it.
Ex-Dividend Date: The date on which the dividend eligibility expires is called the ex-dividend date or simply the ex-date. For instance, if a stock has an ex-date of Monday, May 5, then shareholders who buy the stock on or after that day will NOT qualify to get the dividend as they are buying it on or after the dividend expiry date. Shareholders who own the stock one business day prior to the ex-date – that is on Friday, May 2, or earlier – will receive the dividend. The value of a share of stock goes down by about the dividend amount when the stock goes ex-dividend.
Record Date: The record date is the cut-off date, established by the company in order to determine which shareholders are eligible to receive a dividend or distribution.
Payment Date: The company issues the payment of the dividend on the payment date which is when the money gets credited to investors’ accounts.
The dividend may rise on the announcement approximately by the amount of the dividend declared and then decline by a similar amount at the opening session of the ex-dividend date.
For example, a company that is trading at $50 per share declares a $5 dividend on the announcement date. As soon as the news becomes public, the share price shoots up by around $5 and hit $55. Say the stock trades at $52 one business day prior to the ex-dividend date. On the ex-dividend date, it comes down by a similar $5 and begins trading at $50 at the start of the trading session on the ex-dividend date, because anyone buying on the ex-dividend date will not receive the dividend.
Why companies pay dividend
Companies pay dividends for a variety of reasons. Dividends can be expected by the shareholders as a reward for their trust in a company. The company management may aim to honor this sentiment by delivering a robust track record of dividend payments. Dividend payments reflect positively on a company and help maintain investors’ trust.
A high-value dividend declaration can indicate that the company is doing well and has generated good profits. But it can also indicate that the company does not have suitable projects to generate better returns in the future. Therefore, it is utilizing its cash to pay shareholders instead of reinvesting it into growth
One of the simplest ways for companies to foster goodwill among their shareholders, drive demand for the stock, and communicate financial well-being and shareholder value is through paying dividends. Paying dividends sends a message about a company’s future prospects and performance. Its willingness and ability to pay steady dividends over time provides a solid demonstration of financial strength. Mature firms that believe they can increase value by reinvesting their earnings will choose not to pay dividends.
If a company has a long history of dividend payments, a reduction of the dividend amount, or its elimination, may signal to investors that the company is in trouble. The announcement of a 50% decrease in dividends from General Electric Co. (GE), one of the biggest American industrial companies, was accompanied by a decline of more than six percent in GE’s stock price on November 13, 2017.
A reduction in dividend amount or a decision against making any dividend payment may not necessarily translate into bad news about a company. It may be possible that the company’s management has better plans for investing the money, given its financials and operations. For example, a company’s management may choose to invest in a high-return project that has the potential to magnify returns for shareholders in the long run, as compared to the petty gains they will realize through dividend payments.
It could be when the pricing and conditions are just right for a stock buyback; weathering a major recession becomes the priority; or a company needs to accumulate cash on hand for a big merger or acquisition.
Forms of dividend
A cash dividend is a payment doled out by a company to its stockholders in the form of periodic distributions of cash. Most brokers offer a choice to accept or reinvest cash dividends; reinvesting dividends is often a smart choice for investors with a long-term focus.
A stock dividend is a dividend payment to shareholders that is made in shares rather than as cash. The stock dividend has the advantage of rewarding shareholders without reducing the company’s cash balance, although it can dilute earnings per share. This type of dividend may be made when a company wants to reward its investors but doesn’t have the spare cash or wants to preserve its cash for other investments. This, however, like the cash dividend, does not increase the value of the company. If the company was priced at $10 per share, the value of the company would be $10 million. After the stock dividend, the value will remain the same, but the share price will decrease to $9.52 to adjust for the dividend payout.
Stock dividends can have a negative impact on share price in the short-term. Because it increases the number of shares outstanding while the value of the company remains stable, it dilutes the book value per common share, and the stock price is reduced accordingly.
Fund Dividends v. Company dividends
Dividends paid by funds are different from dividends paid by companies. Company dividends are usually paid from profits that are generated from the company’s business operations. Funds work on the principle of net asset value (NAV), which reflects the valuation of their holdings or the price of the asset(s) that a fund may be tracking. Since funds don’t have any intrinsic profits, they pay dividends sourced from their NAV.
Due to the NAV-based working of funds, regular and high-frequency dividend payments should not be misunderstood as a stellar performance by the fund. For example, a bond-investing fund may pay monthly dividends as it receives money in the form of monthly interest on its interest-bearing holdings. The fund is merely transferring the income from the interest fully or partially to the fund investors. A stock-investing fund may also pay dividends. Its dividends may come from the dividend(s) it receives from the stocks held in its portfolio, or by selling a certain quantity of stocks. It’s likely the investors receiving the dividend from the fund are reducing their holding value, which gets reflected in the reduced NAV on the ex-dividend date.
Arguments Against Dividends
Some financial analyst believe that the consideration of a dividend policy is irrelevant because investors have the ability to create “homemade” dividends. These analysts claim that income is achieved by investors adjusting their asset allocation in their portfolios.
For example, investors looking for a steady income stream are more likely to invest in bonds where the interest payments don’t fluctuate, rather than a dividend-paying stock, where the underlying price of the stock can fluctuate. As a result, bond investors don’t care about a particular company’s dividend policy because their interest payments from their bond investments are fixed.
Another argument against dividends claims that little to no dividend payout is more favorable for investors. Supporters of this policy point out that taxation on a dividend is higher than on a capital gain (In the US). The argument against dividends is based on the belief that a company which reinvests funds (rather than paying them out as dividends) will increase the value of the company in the long-term and, as a result, increase the market value of the stock. According to proponents of this policy, a company’s alternatives to paying out excess cash as dividends are the following: undertaking more projects, repurchasing the company’s own shares, acquiring new companies and profitable assets, and reinvesting in financial assets.
Arguments for Dividends
Proponents of dividends point out that a high dividend payout is important for investors because dividends provide certainty about the company’s financial well-being. Typically, companies that have consistently paid dividends are some of the most stable companies over the past several decades. As a result, a company that pays out a dividend attracts investors and creates demand for their stock.
Dividends are also attractive for investors looking to generate income. However, a decrease or increase in dividend distributions can affect the price of a security. The stock prices of companies that have a long-standing history of dividend payouts would be negatively affected if they reduced their dividend distributions. Conversely, companies that increased their dividend payouts or companies that instituted a new dividend policy would likely see appreciation in their stocks. Investors also see a dividend payment as a sign of a company’s strength and a sign that management has positive expectations for future earnings, which again makes the stock more attractive. A greater demand for a company’s stock will increase its price. Paying dividends sends a clear, powerful message about a company’s future prospects and performance, and its willingness and ability to pay steady dividends over time provides a solid demonstration of financial strength.
Dividend-Paying Methods:
Companies that decide to pay a dividend might use one of the three methods outlined below.
1. Residual
Companies using the residual dividend policy choose to rely on internally generated equity to finance any new projects. As a result, dividend payments can come out of the residual or leftover equity only after all project capital requirements are met.
The benefits to this policy is that it allows a company to use their retained earnings or residual income to invest back into the company, or into other profitable projects before returning funds back to shareholders in the form of dividends.
As stated earlier, a company’s stock price fluctuates with a rising or falling dividend. If a company’s management team doesn’t believe they can adhere to a strict dividend policy with consistent payouts, it might opt for the residual method. The management team is free to pursue opportunities without being constricted by a dividend policy. However, investors might demand a higher stock price relative to companies in the same industry that have more consistent dividend payouts. Another drawback to the residual method is that it can lead to inconsistent and sporadic dividend payouts resulting in volatility in the company’s stock price.
2. Stable
Under the stable dividend policy, companies consistently pay a dividend each year regardless of earnings fluctuations. The dividend payout amount is typically determined through forecasting long-term earnings and calculating a percentage of earnings to be paid out.
Under the stable policy, companies may create a target payout ratio, which is a percentage of earnings that is to be paid to shareholders in the long-term.
The company may choose a cyclical policy that sets dividends at a fixed fraction of quarterly earnings, or it may choose a stable policy whereby quarterly dividends are set at a fraction of yearly earnings. In either case, the aim of the stability policy is to reduce uncertainty for investors and to provide them with income.
3. Hybrid
The final approach combines the residual and stable dividend policies. The hybrid is a popular approach for companies that pay dividends. As companies experience business cycle fluctuations, companies that use the hybrid approach establish a set dividend, which represents a relatively small portion of yearly income and can be easily maintained. In addition to the set dividend, companies can offer an extra dividend paid only when income exceeds certain benchmarks.
Is Dividend Investing a Good Strategy?
Investors should be aware of extremely high yields, since there is an inverse relationship between stock price and dividend yield and the distribution might not be sustainable. Stocks that pay dividends typically provide stability to a portfolio, but do not usually outperform high-quality growth stocks.
It may be counter-intuitive, but as a stock’s price increases, its dividend yield actually decreases. Dividend yield is a ratio of how much cash flow you are getting for each dollar invested in a stock. Many novice investors may incorrectly assume that a higher stock price correlates to a higher dividend yield. Let’s delve into how dividend yield is calculated, so we can grasp this inverse relationship.
If you own 100 shares of the ABC Corporation, the 100 shares is your basis for dividend distribution. Assume for the moment that ABC Corporation was purchased at $100 per share, which implies a total investment of $10,000. Profits at the ABC Corporation were unusually high, so the board of directors agrees to pay its shareholders $10 per share annually in the form of a cash dividend. So, as an owner of ABC Corporation for a year, your continued investment in ABC Corp result in $1,000 dollars of dividends. The annual yield is the total dividend amount ($1,000) divided by the cost of the stock ($10,000) which equals 10 percent.
If ABC Corporation was purchased at $200 per share instead, the yield would drop to five percent, since 100 shares now costs $20,000 (or your original $10,000 only gets you 50 shares, instead of 100). As illustrated above, if the price of the stock moves higher, then dividend yield drops and vice versa. From an investment strategy perspective, buying established companies with a history of good dividends adds stability to a portfolio. This is why many investing legends such as John Bogle, Warren Buffet and Benjamin Graham advocate buying stocks that pay dividends as a critical part of the total “investment” return of an asset.
The Risks to Dividends
During the 2008-2009 financial crisis, almost all of the major banks either slashed or eliminated their dividend payouts. These companies were known for consistent, stable dividend payouts each quarter for literally hundreds of years. Despite their storied histories, many dividends were cut.
In other words, dividends are not guaranteed, and are subject to macroeconomic as well as company-specific risks. Another potential downside to investing in dividend-paying stocks is that companies that pay dividends are not usually high-growth leaders. There are some exceptions, but high-growth companies usually do not pay sizable amounts of dividends to its shareholders even if they have significantly outperformed the vast majority of stocks over time. Growth companies tend to spend more dollars on research and development, capital expansion, retaining talented employees and/or mergers and acquisitions. For these companies, all earnings are considered retained earnings, and are reinvested back into the company instead of issuing a dividend to shareholders.
It is equally important to beware of companies with extraordinarily high yields. As we have learned, if a company’s stock price continues to decline, its yield goes up. Many rookie investors get teased into purchasing a stock just on the basis of a potentially juicy dividend. There is no specific rule of thumb in relation to how much is too much in terms of a dividend payout.
The average dividend yield on S&P 500 index companies that pay a dividend historically fluctuates somewhere between 2 and 5 percent, depending on market conditions. In general, it pays to do your homework on stocks yielding more than 8 percent to find out what is truly going on with the company. Doing this due diligence will help you decipher those companies that are truly in financial shambles from those that are temporarily out of favor, and therefore present a good investment value proposition.
Once a company starts paying dividends, it is highly atypical for it to stop. Dividends are a good way to give an investment portfolio additional stability, since the periodical cash payments are likely to continue long term.
A company must keep growing at an above-average pace to justify reinvesting in itself rather than paying a dividend. Generally speaking, when a company’s growth slows, its stock won’t climb as much, and dividends will be necessary to keep shareholders around. The slowdown of this growth happens to virtually all companies after they attain a large market capitalization. A company will simply reach a size at which it no longer has the potential to grow at annual rates of 30% to 40%, like a small cap, regardless of how much money is plowed back into it. At a certain point, the law of large numbers makes a mega-cap company and growth rates that outperform the market an impossible combination.
There is another motivation for a company to pay dividends —a steadily increasing dividend payout is viewed as a strong indication of a company’s continuing success. The great thing about dividends is that they can’t be faked; they are either paid or not paid, increased or not increased.
This isn’t the case with earnings, which are basically an accountant’s best guess of a company’s profitability. All too often, companies must restate their past reported earnings because of aggressive accounting practices, and this can cause considerable trouble for investors, who may have already based future stock price predictions on these unreliable historical earnings. Expected groeth rates are also unreliable
Since they can be regarded as quasi-bonds, dividend-paying stocks tend to exhibit pricing characteristics that are moderately different from those of growth stocks. This is because they provide regular income that is similar to a bond, but they still provide investors with the potential to benefit from share price appreciation if the company does well.
Investors looking for exposure to the growth potential of the equity market and the safety of the (moderately) fixed income provided by dividends should consider adding stocks with high dividend yields to their portfolio. A portfolio with dividend-paying stocks is likely to see less price volatility than a growth stock portfolio.
Misconceptions About Dividend Stocks
The biggest misconception of dividend stocks is that a high yield is always a good thing. Many dividend investors simply choose a collection of the highest dividend-paying stock and hope for the best. For a number of reasons, this is not always a good idea.
Dividend Stocks are Always Boring. Some of the best traits a dividend stock can have are the announcement of a new dividend, high dividend growth metrics over recent years, or the potential to commit more and raise the dividend (even if the current yield is low). Any of these announcements can jolt the stock price and result in a greater total return. Sure, trying to predict management’s dividends and whether a dividend stock will go up in the future is not easy, but there are several indicators. If a stock has a low dividend payout ratio but it is generating high levels of free cash flow, it obviously has room to increase its dividend. Earnings growth is one indicator but also keep an eye on cash flow and revenues as well. If a company is growing organically (i.e. increased foot traffic, sales, margins), then it may only be a matter of time before the dividend is increased. However, if a company’s growth is coming from high-risk investments or international expansion then a dividend could be less certain
Dividend Stocks are Always Safe. Just because a company is producing dividends doesn’t always make it a safe bet. Management can use the dividend to placate frustrated investors when the stock isn’t moving. (In fact, many companies have been known to do this.) Therefore, to avoid dividend traps, it’s always important to at least consider how management is using the dividend in its corporate strategy. Dividends that are consolation prizes to investors for a lack of growth are almost always bad ideas.
Compounding Effect
If dividends are re-invested it can create a compounding effect as show in the graphs below gathered from visualcapitalist.
The dividend yield, expressed as a percentage, is a financial ratio (dividend/price) that shows how much a company pays out in dividends each year relative to its stock price.
The dividend yield is an estimate of the dividend-only return of a stock investment. Assuming the dividend is not raised or lowered, the yield will rise when the price of the stock falls. Because dividend yields change relative to the stock price, it can often look unusually high for stocks that are falling in value quickly.
The dividend yield can be calculated from the last full year’s financial report. This is acceptable during the first few months after the company has released its annual report; however, the longer it has been since the annual report, the less relevant that data is for investors. Alternatively, investors can also add the last four quarters of dividends, which captures the trailing 12 months of dividend data. Using a trailing dividend number is acceptable, but it can make the yield too high or too low if the dividend has recently been cut or raised.
Because dividends are paid quarterly, many investors will take the last quarterly dividend, multiply it by four, and use the product as the annual dividend for the yield calculation. This approach will reflect any recent changes in the dividend, but not all companies pay an even quarterly dividend. Some firms, especially outside the U.S., pay a small quarterly dividend with a large annual dividend. If the dividend calculation is performed after the large dividend distribution, it will give an inflated yield. Finally, some companies pay a dividend more frequently than quarterly. A monthly dividend could result in a dividend yield calculation that is too low. When deciding how to calculate the dividend yield, an investor should look at the history of dividend payments to decide which method will give the most accurate results.
Historical evidence suggests that a focus on dividends may amplify returns rather than slow them down. For example, according to analysts at Hartford Funds, since 1970, 78% of the total returns from the S&500 are from dividends. This assumption is based on the fact that investors are likely to reinvest their dividends back into the S&P 500, which then compounds their ability to earn more dividends in the future.
When comparing measures of corporate dividends, it’s important to note that the dividend yield tells you what the simple rate of return is in the form of cash dividends to shareholders. However, the dividend payout ratio represents how much of a company’s net earnings are paid out as dividends. While the dividend yield is the more commonly used term, many believe the dividend payout ratio is a better indicator of a company’s ability to distribute dividends consistently in the future. The dividend payout ratio is highly connected to a company’s cash flow.
The dividend yield shows how much a company has paid out in dividends over the course of a year. The yield is presented as a percentage, not as an actual dollar amount. This makes it easier to see how much return the shareholder can expect to receive per dollar they have invested.
A forward dividend yield is the percentage of a company’s current stock price that it expects to pay out as dividends over a certain time period, generally 12 months. Forward dividend yields are generally used in circumstances where the yield is predictable based on past instances. If not, trailing yields, which indicate the same value over the previous 12 months, are used.
A dividend aristocrat is a company that has increased its dividends for at least 25 consecutive years.
Dividend Payout Ratio
The dividend payout ratio is the ratio of the total amount of dividends paid out to shareholders relative to the net income of the company. It is the percentage of earnings paid to shareholders in dividends. The amount that is not paid to shareholders is retained by the company to pay off debt or to reinvest in core operations. It is sometimes simply referred to as the ‘payout ratio.’
The dividend payout ratio provides an indication of how much money a company is returning to shareholders versus how much it is keeping on hand to reinvest in growth, pay off debt, or add to cash reserves (retained earnings).
Some companies pay out all their earnings to shareholders, while some only pay out a portion of their earnings. If a company pays out some of its earnings as dividends, the remaining portion is retained by the business. To measure the level of earnings retained, the retention ratio is calculated.
Several considerations go into interpreting the dividend payout ratio, most importantly the company’s level of maturity. A new, growth-oriented company that aims to expand, develop new products, and move into new markets would be expected to reinvest most or all of its earnings and could be forgiven for having a low or even zero payout ratio. The payout ratio is 0% for companies that do not pay dividends and is 100% for companies that pay out their entire net income as dividends.
The payout ratio is also useful for assessing a dividend’s sustainability. Companies are extremely reluctant to cut dividends since it can drive the stock price down and reflect poorly on management’s abilities. If a company’s payout ratio is over 100%, it is returning more money to shareholders than it is earning and will probably be forced to lower the dividend or stop paying it altogether. That result is not inevitable, however. A company endures a bad year without suspending payouts, and it is often in their interest to do so. It is therefore important to consider future earnings expectations and calculate a forward-looking payout ratio to contextualize the backward-looking one.
Long-term trends in the payout ratio also matter. A steadily rising ratio could indicate a healthy, maturing business, but a spiking one could mean the dividend is heading into unsustainable territory.
The retention ratio is a converse concept to the dividend payout ratio. The dividend payout ratio evaluates the percentage of profits earned that a company pays out to its shareholders, while the retention ratio represents the percentage of profits earned that are retained by or reinvested in the company.
Dividend payouts vary widely by industry, and like most ratios, they are most useful to compare within a given industry
The augmented payout ratio incorporates share buybacks into the metric; it is calculated by dividing the sum of dividends and buybacks by net income for the same period. If the result is too high, it can indicate an emphasis on short-term boosts to share prices at the expense of reinvestment and long-term growth. Another adjustment that can be made to provide a more accurate picture is to subtract preferred stock dividends for companies that issue preferred shares.
Dividends Per Share
Dividends per share (DPS) measures the total amount of profits a company pays out to its shareholders, generally over a year, on a per-share basis. DPS can be calculated by subtracting the special dividends from the sum of all dividends over one year and dividing this figure by the outstanding shares
There are two primary reasons for increases in a company’s dividends per share payout.
The first is simply an increase in the company’s net profits out of which dividends are paid. If the company is performing well and cash flows are improving, there is more room to pay shareholders higher dividends. In this context, a dividend hike is a positive indicator of company performance.
The second reason a company might hike its dividend is because of a shift in the company’s growth strategy, which leads the company to expend less of its cash flow and earnings on growth and expansion, thus leaving a larger share of profits available to be returned to equity investors in the form of dividends.
Dividend Growth Rate
Dividend growth calculates the annualized average rate of increase in the dividends paid by a company. Calculating the dividend growth rate is necessary for using a dividend discount model for valuing stocks. The dividend discount model is a type of security-pricing model. The dividend discount model assumes that the estimated future dividends–discounted by the excess of internal growth over the company’s estimated dividend growth rate–determines a given stock’s price. If the dividend discount model procedure results in a higher number than the current prize of a company’s shares, the model considers the stock undervalued. Investors who use the dividend discount model believe that by estimating the expected value of cash flow in the future, they can find the intrinsic value of a specific stock. A history of strong dividend growth could mean future dividend growth is likely, which can signal long-term profitability.
Dividend capture strategy
A dividend capture strategy is a timing-oriented investment strategy involving the timed purchase and subsequent sale of dividend-paying stocks. Dividend capture is specifically calls for buying a stock just prior to the ex-dividend date in order to receive the dividend, then selling it immediately after the dividend is paid.The purpose of the two trades is simply to receive the dividend, as opposed to investing for the longer term. Because markets tend to be somewhat efficient, stocks usually decline in value immediately following ex-dividend, the viability of this strategy has come into question.
Theoretically, the dividend capture strategy shouldn’t work. If markets operated with perfect logic, then the dividend amount would be exactly reflected in the share price until the ex-dividend date, when the stock price would fall by exactly the dividend amount. Since markets do not operate with such mathematical perfection, it doesn’t usually happen that way. Most often, a trader captures a substantial portion of the dividend despite selling the stock at a slight loss following the ex-dividend date. A typical example would be a stock trading at $20 per share, paying a $1 dividend, falling in price on the ex-date only down to $19.50, which enables a trader to realize a net profit of $0.50, successfully capturing half the dividend in profit.
Transaction costs further decrease the sum of realized returns. The potential gains from a pure dividend capture strategy are typically small, while possible losses can be considerable if a negative market movement occurs within the holding period. A drop in stock value on the ex-date which exceeds the amount of the dividend may force the investor to maintain the position for an extended period of time, introducing systematic and company-specific risk into the strategy. Adverse market movements can quickly eliminate any potential gains from this dividend capture approach. In order to minimize these risks, the strategy should be focused on short term holdings of large blue-chip companies. If dividend capture was consistently profitable, computer-driven investment strategies would have already exploited this opportunity.
Analysis Check
Notable dividend: Is the companies dividend notable compared to the bottom 25% of dividend players in the country’s(eg. Norwegian) market.
High dividend: How does the companies dividend compare to the top 25% of dividend players in the country’s market.
Stable dividend: Have the dividend payments been stable in the past 10 years
Growing dividend: Have the dividend payments grown over the last 10 years.
Dividend coverage: Are the dividend covered by the earnings. Look at payout ratio.
Future dividend coverage: is the dividend forecasted to be covered by earnings in three years? Look at payout ratio.