Introduction
Intel Corporation is a leading American multinational technology company specializing in the design and manufacturing of semiconductor chips and computing components. Headquartered in Santa Clara, California, and incorporated in Delaware, Intel has played a pivotal role in shaping modern computing. The company is best known for its microprocessors, which power the majority of personal computers (PCs) worldwide, and its contributions to high-performance computing, AI, and data center technologies.
Illustration1: Logo of the Intel corporation which symbolizes Intel’s power in peoples mind
As one of the largest semiconductor manufacturers by revenue, Intel has been a dominant force in the industry for decades. The company has consistently ranked among the top U.S. corporations on the Fortune 500 list, demonstrating its strong financial performance and market influence. Beyond CPUs, Intel produces chipsets, network interface controllers, GPUs, FPGAs, and memory solutions, making it a key player in the computing ecosystem.
History
Intel was founded on July 18, 1968, by semiconductor pioneers Gordon Moore (famous for Moore’s Law) and Robert Noyce, along with investor Arthur Rock. Under the leadership of Andrew Grove, Intel became a driving force behind Silicon Valley’s rise as a global tech hub. Initially, the company focused on SRAM and DRAM memory chips, which were its primary revenue sources until the early 1980s.
Intel’s breakthrough came in 1971 with the release of the Intel 4004, the world’s first commercial microprocessor. However, it wasn’t until the 1990s—when the PC revolution gained momentum—that microprocessors became Intel’s core business. The strategic alliance between Microsoft Windows and Intel (“Wintel”) cemented Intel’s dominance in the industry, as its CPUs became the standard for personal and enterprise computing.
By the late 1990s and early 2000s, Intel was the undisputed leader in the microprocessor market, holding over 90% market share in PC CPUs. However, the company also faced antitrust challenges and growing competition, particularly from AMD. Despite these challenges, Intel continued to innovate, pushing the boundaries of CPU performance, efficiency, and scalability.
Since the late 2010s, Intel has faced increasing competition from AMD, NVIDIA, and ARM-based processors, leading to a decline in its market dominance. However, Intel remains the leader in the x86 CPU market, holding a 68.4% share as of 2023. Unlike many of its competitors, Intel designs and manufactures its own chips, a rare advantage in the semiconductor industry where most companies rely on third-party manufacturers like TSMC and Samsung.
With a renewed focus on AI, data centers, and advanced chip manufacturing, Intel is investing heavily in next-generation process technologies and expanding its semiconductor fabrication facilities (fabs). The company aims to regain its competitive edge and reinforce its position as a leader in the evolving semiconductor landscape.
Operations and Products
- Microprocessor and Semiconductor Manufacturing
Intel is one of the world’s largest manufacturers of microprocessors, producing chips for personal computers (PCs), servers, data centers, and embedded systems.
The company’s flagship Intel Core and Xeon processors power a vast majority of consumer and enterprise computing devices. Intel has remained a leader in CPU development, continuously innovating with new architectures, manufacturing nodes, and efficiency improvements.
Beyond CPUs, Intel also develops chipsets, graphics processing units (GPUs), memory solutions (Optane SSDs), and field-programmable gate arrays (FPGAs). The company manufactures its own chips in Intel Foundry Services (IFS), distinguishing itself from competitors like AMD and NVIDIA, which rely on third-party fabs like TSMC. Intel is actively investing in advanced semiconductor fabrication and is working towards regaining leadership in chip manufacturing with cutting-edge process nodes like Intel 4 and Intel 3.
- Data Centric AI Solutions
Intel has expanded beyond traditional computing into AI, cloud computing, and data center technologies. The Intel Xeon Scalable Processors dominate the server and cloud computing markets, providing businesses with high-performance computing (HPC) and enterprise-grade AI capabilities.
Additionally, Intel’s AI-focused hardware, including Intel Gaudi AI accelerators and Intel Arc GPUs, is designed to compete in the growing machine learning and artificial intelligence sectors. The company is also actively involved in networking and 5G infrastructure, offering programmable solutions for cloud service providers and telecom operators.

Illustration 2: An Intel Core CPU, which is part of its core business
- Emerging Technologies and Future Growth Areas
Intel is making significant investments in next-generation semiconductor technologies, energy-efficient computing, and quantum computing. The company’s R&D efforts focus on improving chip performance, reducing power consumption, and enhancing cybersecurity.
As part of its strategic expansion, Intel is also developing self-driving car technologies through Mobileye, a subsidiary specializing in automotive AI and autonomous vehicle systems. With the increasing demand for AI computing and data processing, Intel is positioning itself as a key player in the evolving technology landscape.
Revenue Breakdown
Client Computing Group (CCG) – This segment accounts for 50-55% of Intel’s total revenue, making it the largest contributor. It includes the sale of Intel Core processors for laptops, desktops, and other personal computing devices. While Intel remains a dominant force in the PC processor market, it faces increasing competition from AMD and Apple’s in-house silicon.

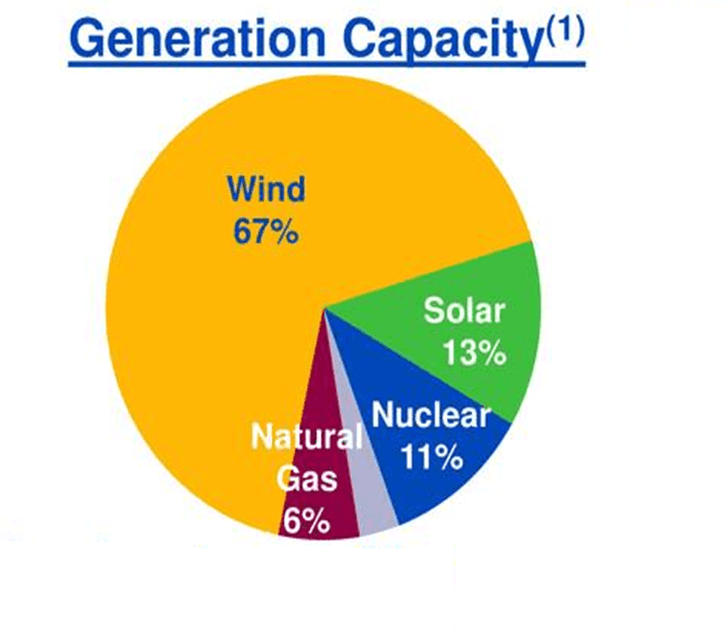
Illustration 3: Revenue breakdown for Intel Corporation from Tipranks.
Data Center and AI Group (DCAI) – Responsible for 30-35% of Intel’s revenue, this segment focuses on Intel Xeon processors, AI accelerators, and cloud computing solutions. With the increasing adoption of AI and high-performance computing (HPC), Intel continues to expand its data center offerings. However, growing competition from NVIDIA and AMD has pressured this segment’s growth.
Network and Edge (NEX) & Foundry Services – Contributing 10-15% of Intel’s revenue, these segments include 5G network infrastructure, edge computing, and custom semiconductor manufacturing (Intel Foundry Services, or IFS). Intel is investing heavily in chip fabrication to compete with TSMC and Samsung while strengthening its position in the semiconductor supply chain.
Mobileye & Other Emerging Technologies – This is Intel’s smallest revenue segment, contributing 5-10%. Mobileye specializes in autonomous vehicle technology, providing ADAS (Advanced Driver Assistance Systems) and AI-powered automotive solutions. Intel is also making strides in quantum computing, neuromorphic chips, and AI-focused hardware.
Key Competitors
Intel operates in a highly competitive semiconductor industry, facing strong rivals across different market segments. Its key competitors include:
- AMD (Advanced Micro Devices, Inc.) – Intel’s primary competitor in the CPU market, AMD has gained significant market share with its Ryzen and EPYC processor lines. AMD’s Zen architecture has challenged Intel’s dominance in both consumer and data center markets, particularly in multi-core performance and power efficiency.
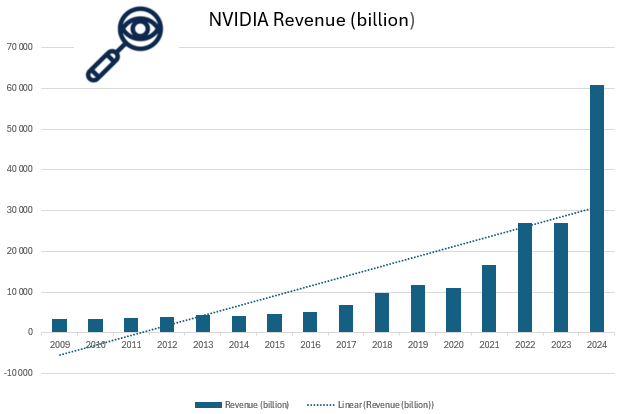
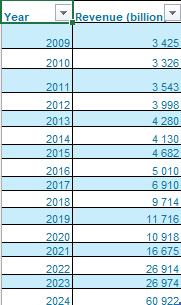
- NVIDIA Corporation – While historically focused on graphics processing units (GPUs), NVIDIA has expanded into AI, high-performance computing (HPC), and data centers, areas that overlap with Intel’s Xeon and AI accelerator businesses. NVIDIA’s CUDA ecosystem and AI chips (such as the H100 and upcoming Blackwell series) present a major challenge to Intel’s ambitions in AI-driven computing.
- TSMC (Taiwan Semiconductor Manufacturing Company) – As the world’s largest contract chip manufacturer, TSMC produces cutting-edge chips for companies like Apple, AMD, and NVIDIA. Intel is attempting to compete in semiconductor manufacturing with its Intel Foundry Services (IFS), but TSMC leads in advanced process nodes (e.g., 3nm, 5nm), posing a significant challenge to Intel’s manufacturing business.
Competitive Advantage
Unlike many competitors that depend on third-party foundries like TSMC, Intel both designs and manufactures its own chips, allowing for greater control over production, innovation, and supply chain management. The company makes significant investments in R&D, focusing on advanced semiconductor technology, AI, high-performance computing (HPC), and quantum computing. Intel remains a leader in processor architecture, driving advancements in Intel Core, Xeon, and AI-powered accelerators.

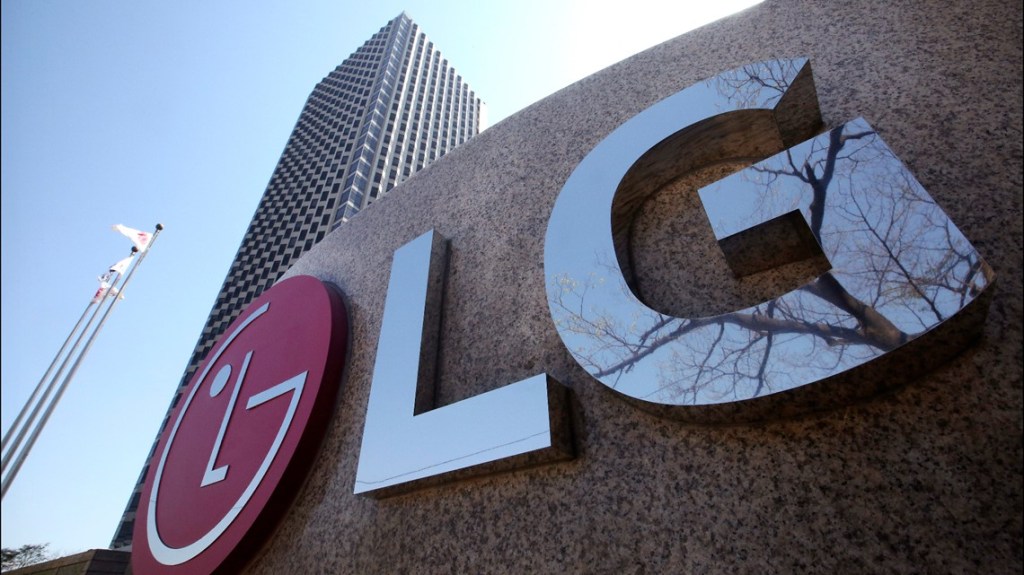
Illustration 4: Outside Intel’s headquarters in Santa Clara, California.
With breakthrough technologies like Intel 3 and Intel 18A process nodes, Intel is working to regain process leadership in semiconductor manufacturing. Its vertically integrated model, which combines chip design and fabrication in-house, offers long-term cost efficiencies and technological advantages over competitors that outsource production.
Intel’s comprehensive product lineup spans PC processors (Intel Core), data center solutions (Xeon), GPUs (Intel Arc), networking hardware, AI accelerators, and foundry services, ensuring its strong presence across multiple high-growth technology sectors.
Future Outlook
Looking ahead, Intel Corporation is well-positioned to drive future growth as demand for high-performance computing, AI, and semiconductor innovation continues to rise. The company’s strong brand, cutting-edge technology, and global manufacturing footprint provide a solid foundation for long-term success.
Intel stands to benefit from government initiatives supporting domestic semiconductor production, such as the CHIPS Act, which aims to boost U.S. chip manufacturing. With increasing demand for AI accelerators, data center solutions, and advanced semiconductor nodes, Intel is expected to remain a key player in the industry.
Furthermore, Intel’s expansion into new markets, including foundry services, AI-driven computing, and emerging global tech hubs, presents significant growth opportunities in the coming years.
Stock Analysis
In this section we will analyze Intel Corporation’s stock to see if it is a good stock to buy or not. Our philosophy is value investing meaning that we try to find good quality companies that are undervalued. However, we will give a holistic overview so all kind of investors with different philosophies can judge the stock for themselves.
Revenue and Profits
To determine a company’s worth and if it is worth investing in, the company’s revenue and profits are a natural starting point to analyze. It should never bee forgotten that a stock represents a company just like the small businesses in your home town. If someone asked you if you want to buy their company, the first question would naturally be how much the company makes and the same question when trying to analyze if a company registered in the stock exchange is worth buying.

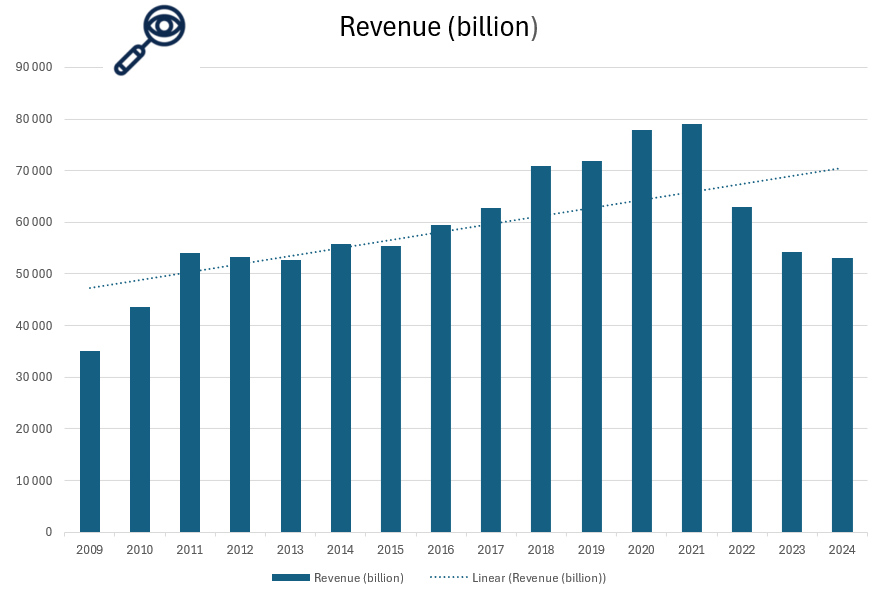
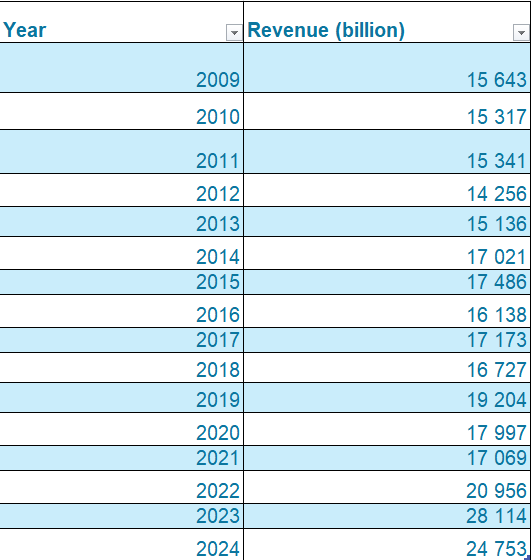
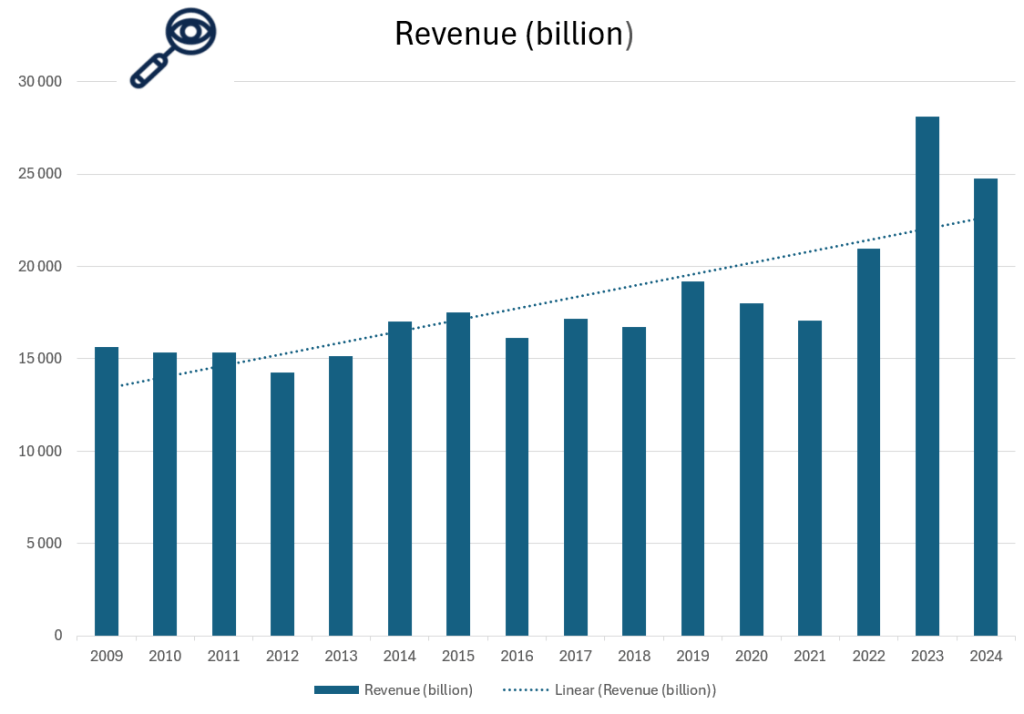
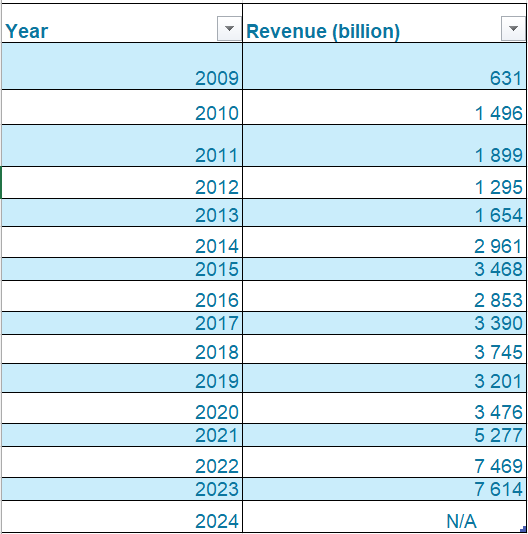
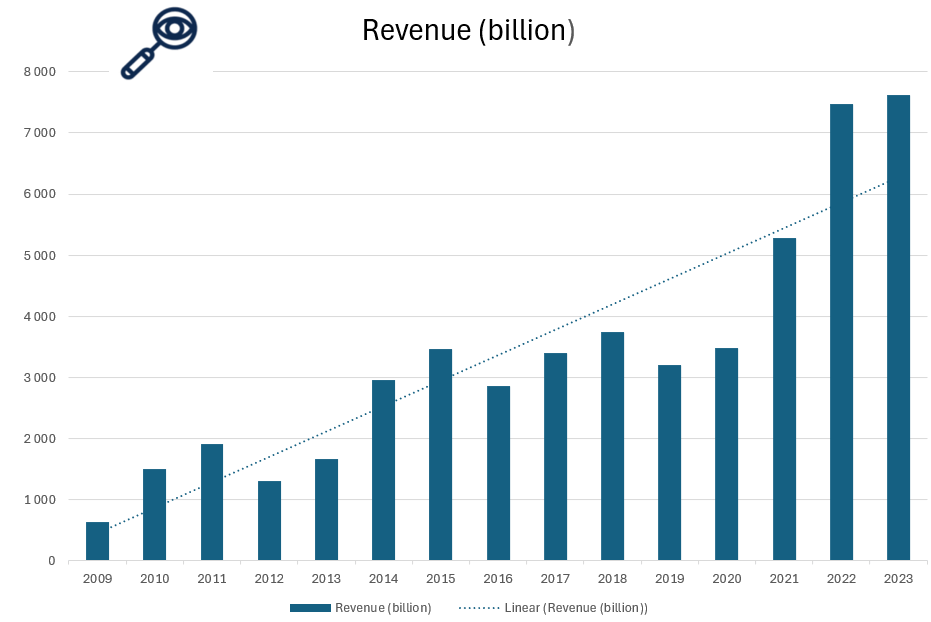
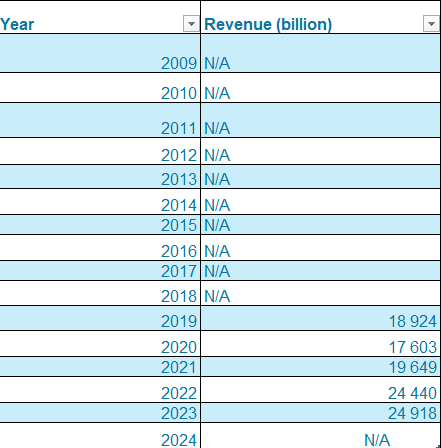
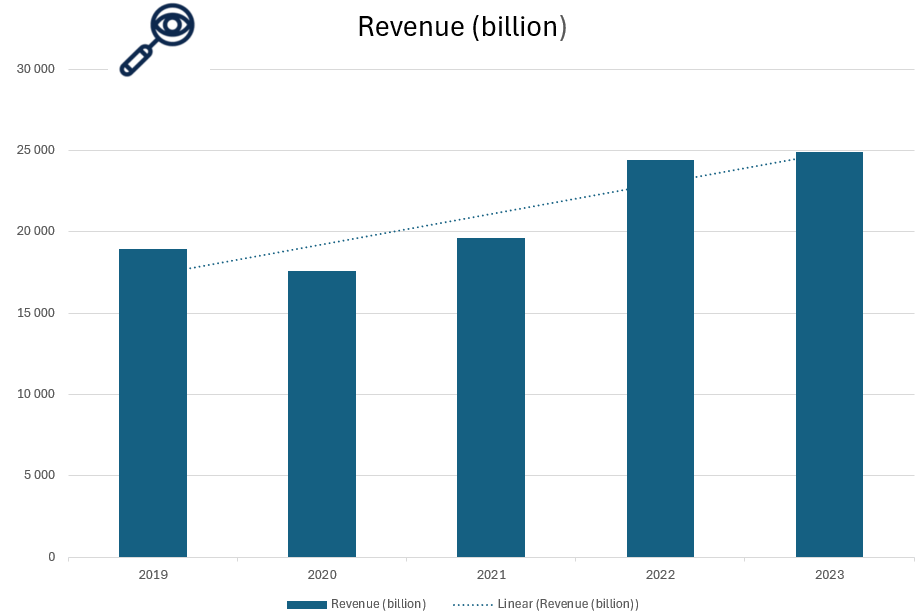
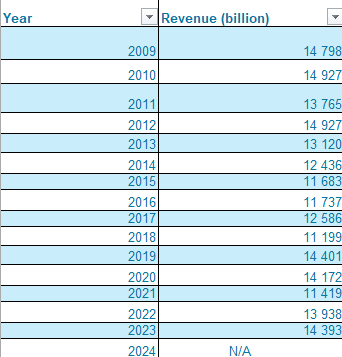
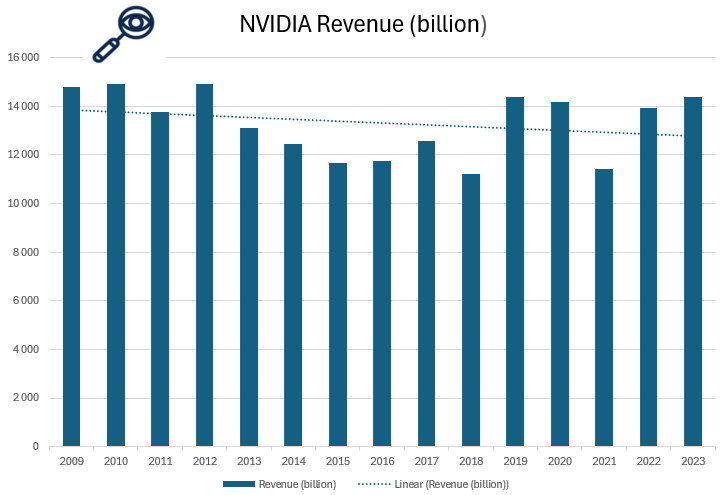
Illustration 5 and 6: Revenue for Intel Corporation from 2009 to 2024
As shown in recent financial reports, Intel Corporation has experienced steady revenue growth over the long term, particularly in recent years. In 2023, Intel’s revenue was approximately $63.1 billion, driven by rising global demand for high-performance computing, AI, data center solutions, and semiconductor innovation. Intel’s expansion into new markets, such as AI accelerators and foundry services, as well as increased demand for data center chips and consumer processors, continues to support its growth trajectory.
However, despite this general upward trend, Intel’s revenue growth has faced some volatility. As seen in recent years, Intel’s revenue declined in 2021 and 2024, largely due to increased competition in the semiconductor industry, challenges in transitioning to new process technologies, and market fluctuations. For investors, this volatility could be a concern, as it suggests that Intel’s revenue growth may not always be consistent, making it a potentially riskier investment compared to companies with more predictable financial performance. Increased competition has also eaten Intel’s market share leading to a concerning decrease in decline from 2021 to 2024. Even though Intel’s revenue before this was on an increasing trend upwards, the recent decline should be red flag as increased competition in the industry is to be expected to be a lasting problem.

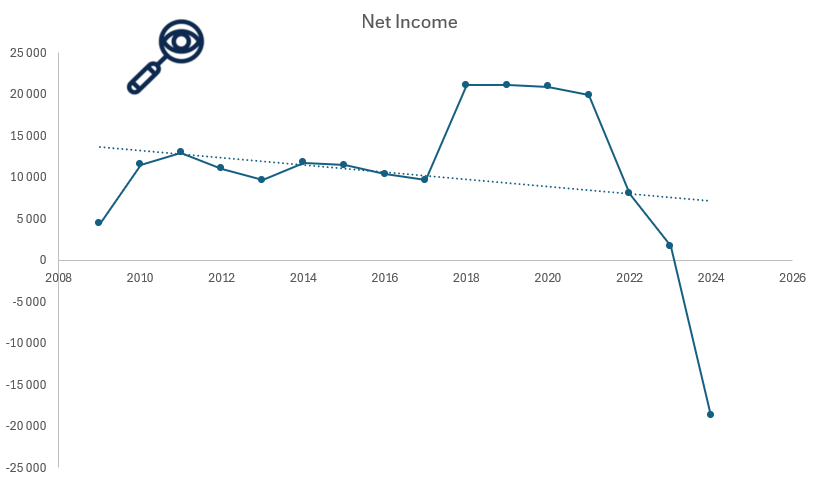
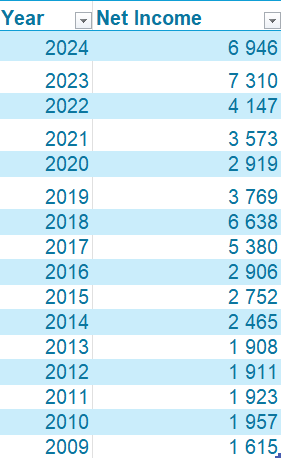
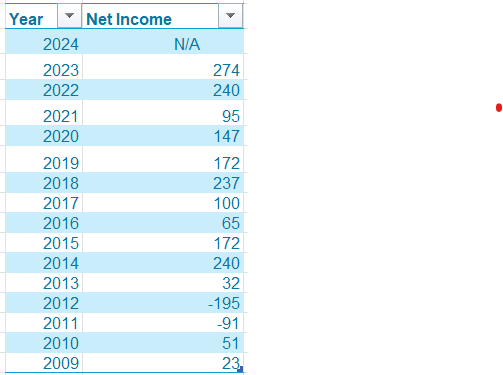
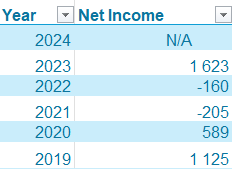
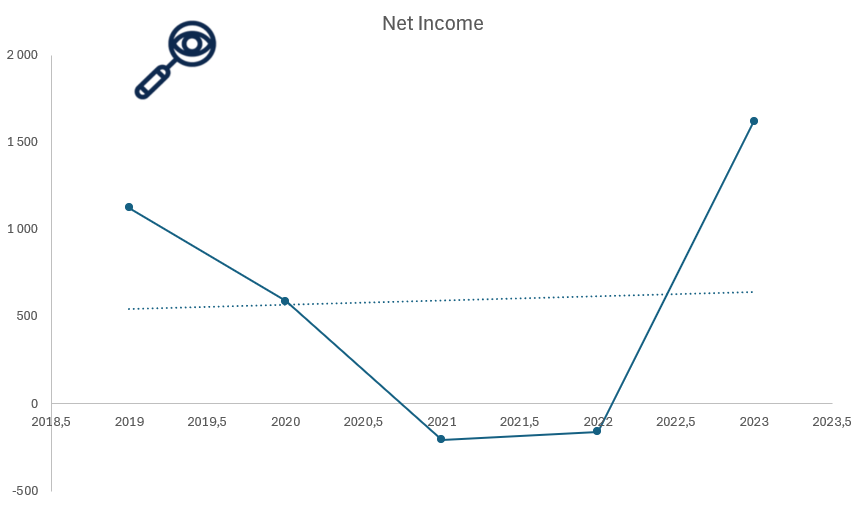
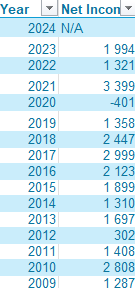
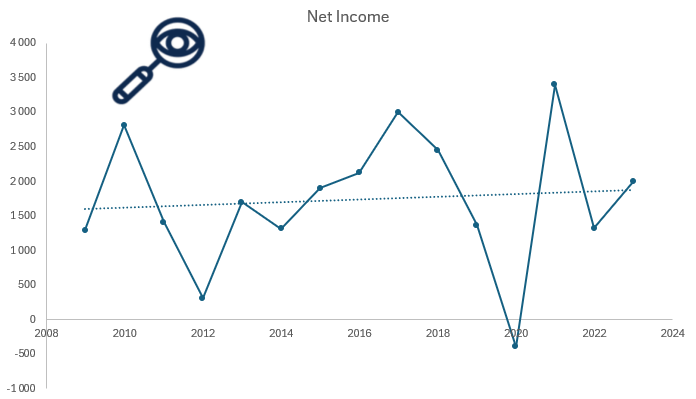
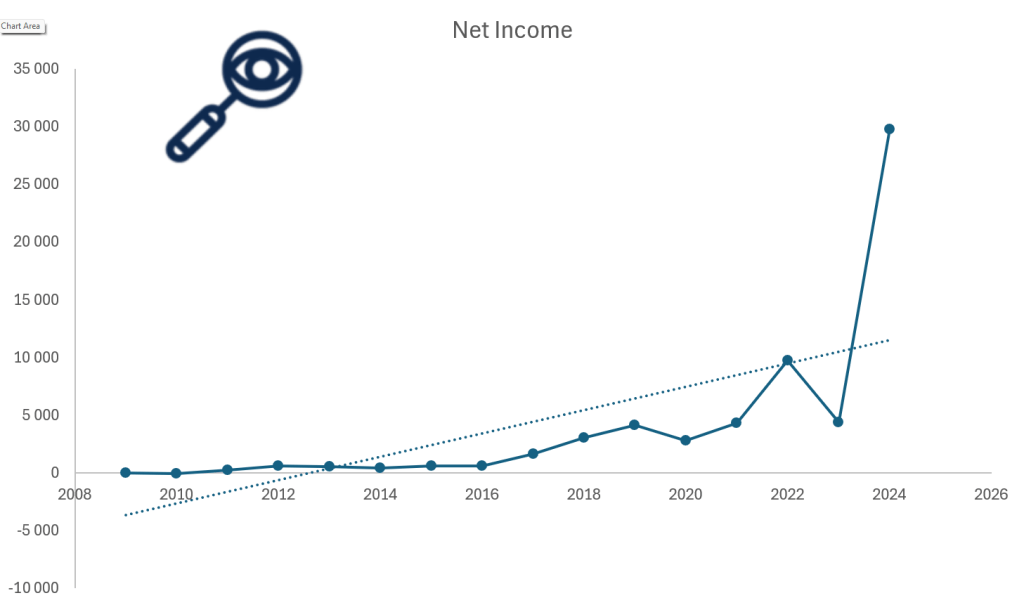
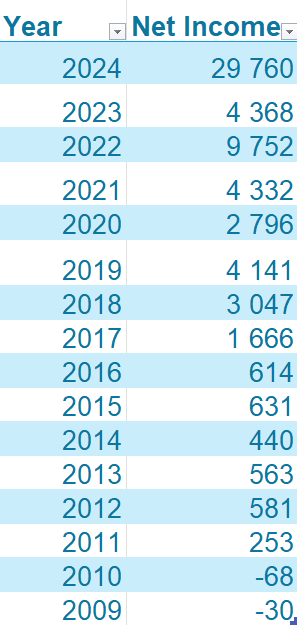
Illustration 7 and 8: Net Income for Intel Corporation from 2009 to 2024
Net income is a crucial metric to evaluate when determining whether a company is a worthwhile investment. It represents a company’s net profit or loss after accounting for all revenues, income items, and expenses, calculated as Net Income = Revenue – Expenses.
The Net Income of Intel Corporation is a red flag as it has been both volatile and on a strongly negative trend in the last couple of years, as can be seen in illustration 8 from 2021 to 2024. This negative trend is due to several factors, including increased competition from companies like AMD and Nvidia, higher operational costs, delays in transitioning to new manufacturing processes, and investments in long-term projects such as AI and semiconductor R&D. The Net Income in 2024 was negative, which is a red flag for potential investors, as it signals a lack of profitability and could indicate challenges in maintaining competitive market positioning. The net income of intel should be watched very closely be any potential investors.
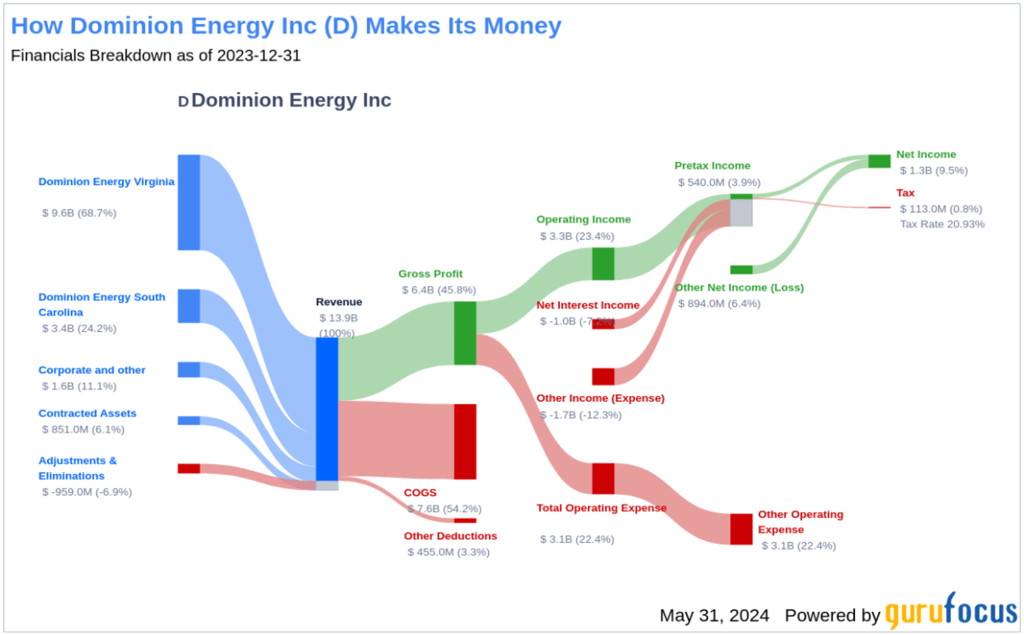
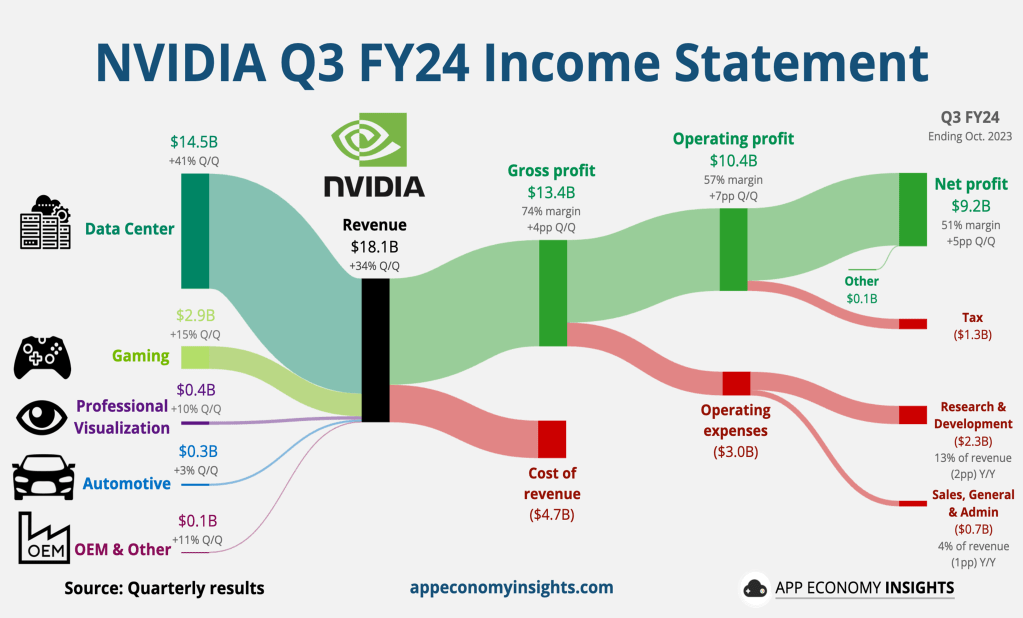
Revenue breakdown
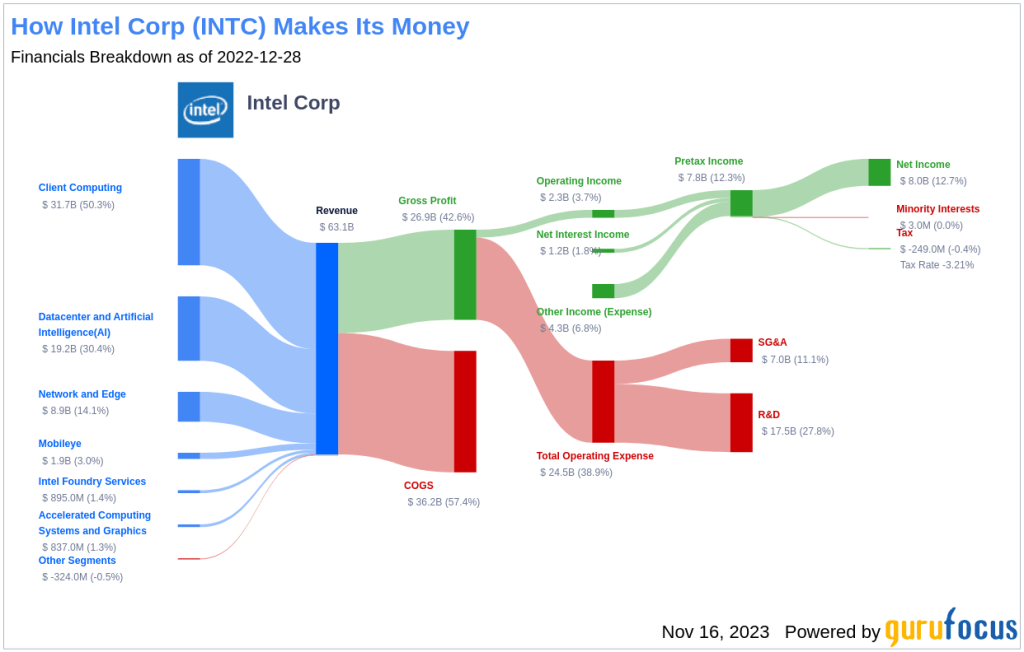
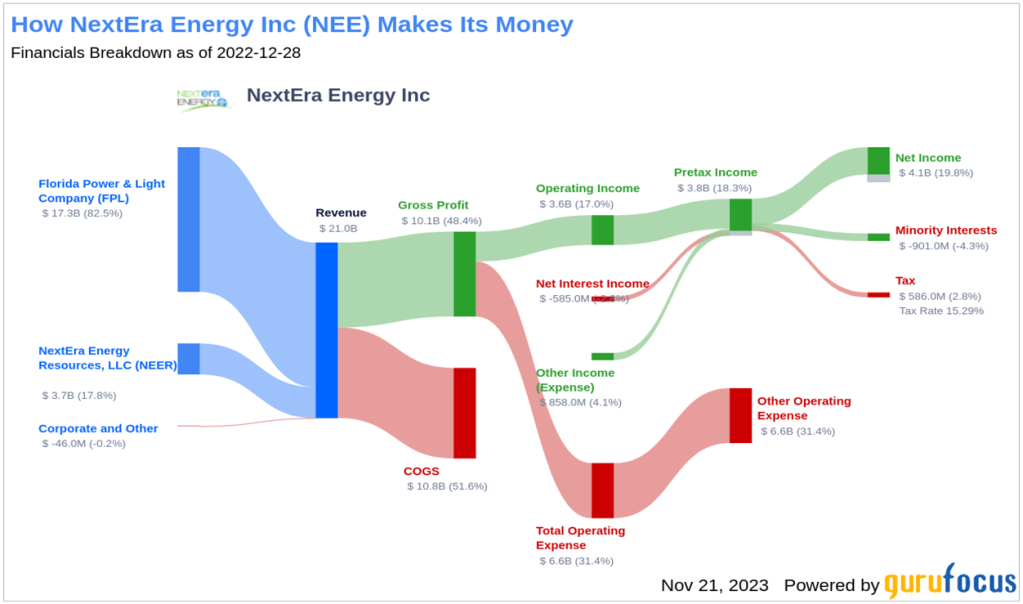
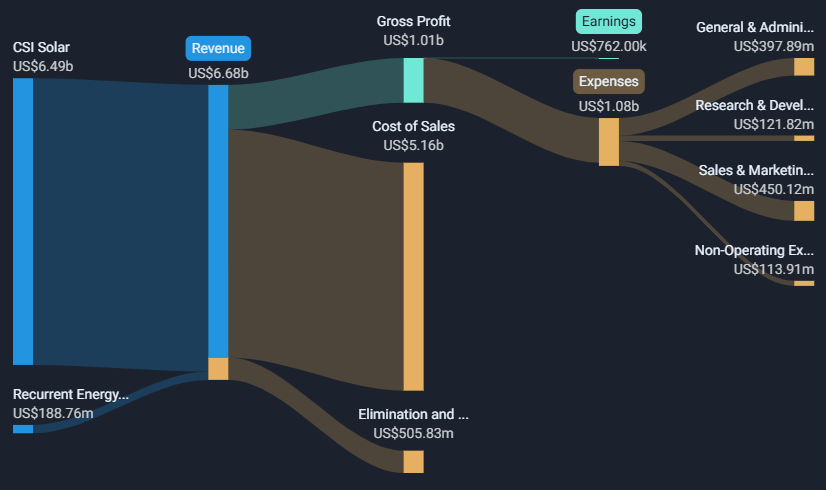
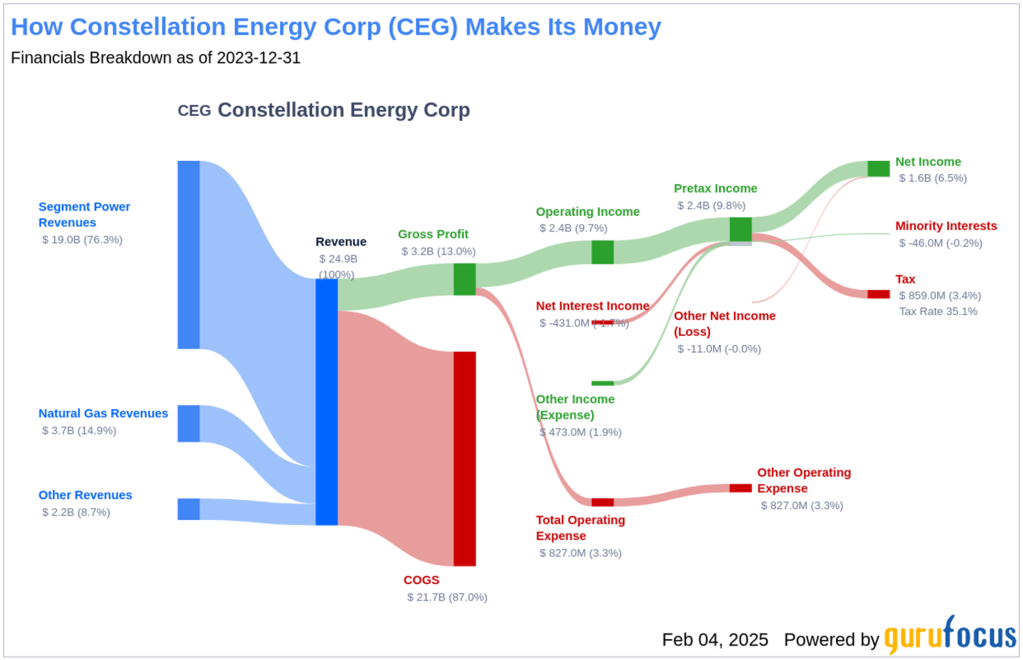
Illustration 9: Revenue Breakdown of Intel Corporation
As can be seen from illustration 9, Intel Corporation has a good variety of different revenue sources in the technology sector, which is a positive sign as it shows the company’s diversification and ability to capitalize on multiple markets. COGS and operating expenses eat up a good part of the profit, which is to be expected in a capital-intensive industry. However, a very positive sign for Intel is that the majority of its operating expenses is allocated to R&D. This investment in research and development in the long term provides Intel with better technology, a competitive advantage, and the ability to stay at the forefront of innovation in areas such as AI, high-performance computing, and semiconductor manufacturing. This focus on R&D positions Intel well for future growth and resilience in the highly competitive tech sector. The revenue breakdown of intel corporation is a green flag for potential investors.
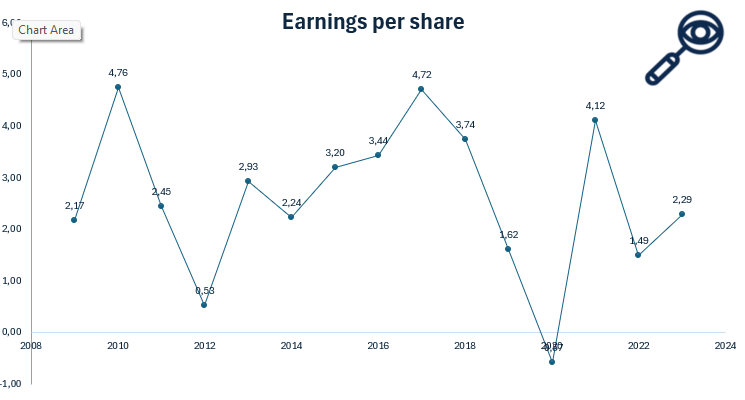
Earnings per shar (EPS)
Earnings Per Share (EPS) is a key financial metric that measures a company’s profitability on a per-share basis. It indicates how much profit a company generates for each outstanding share of its stock, and is used o assess a company’s financial health, profitability, and potential for growth. In other words this metric can tell us how profitable the business is.
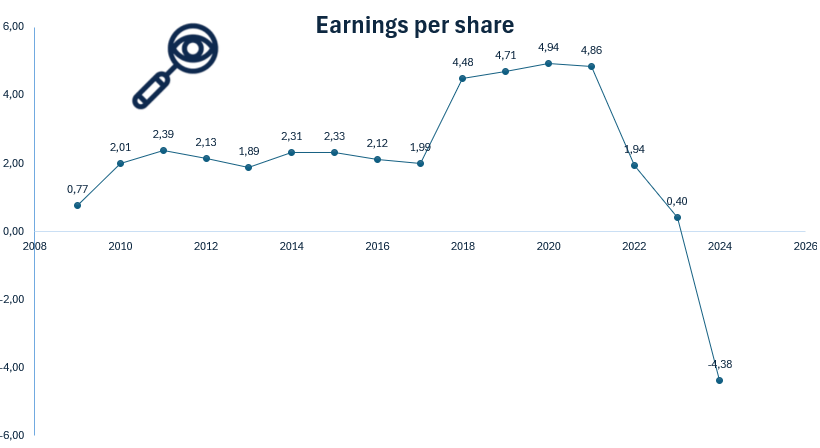
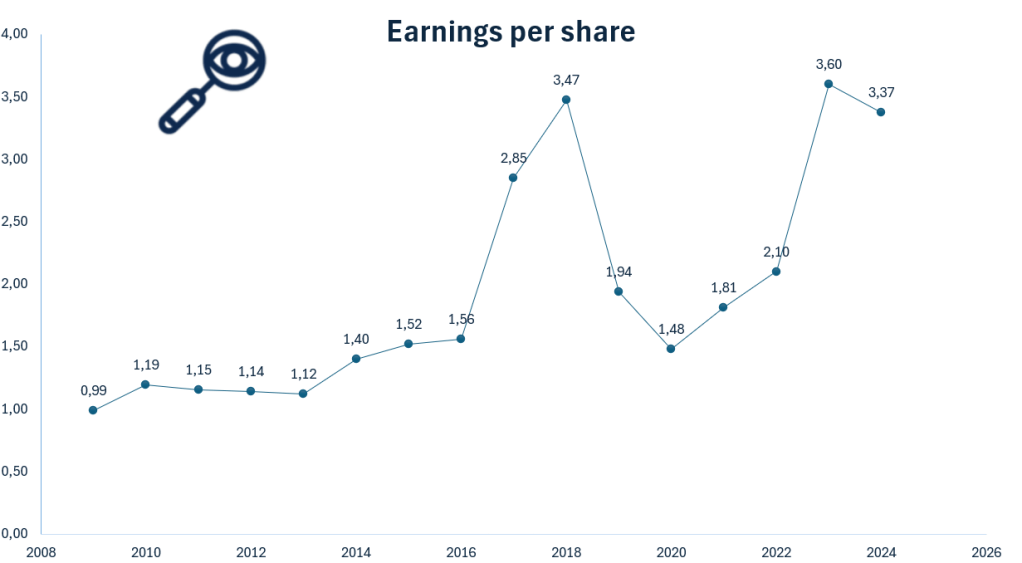
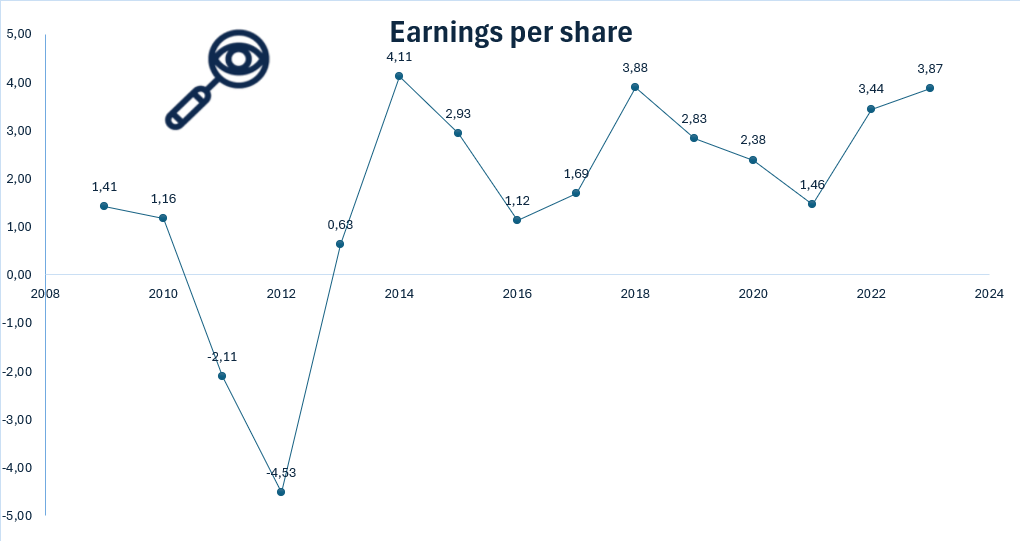
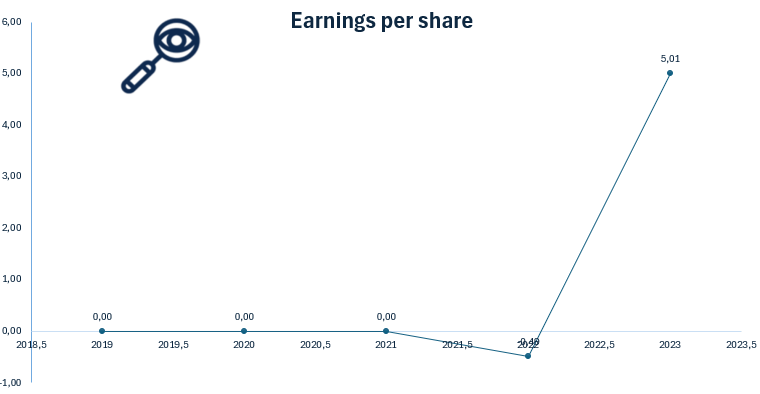
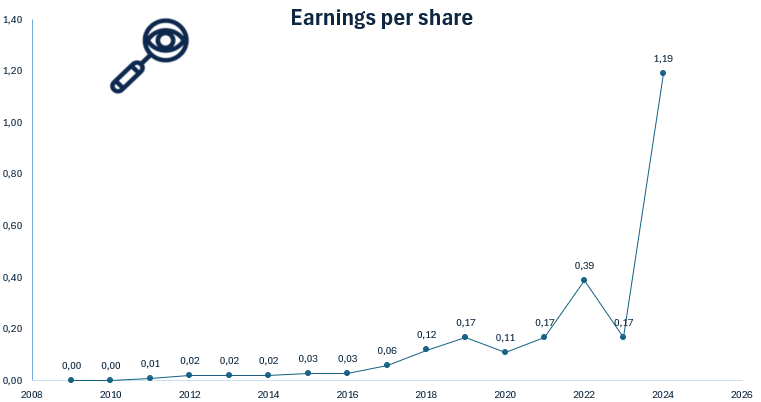
Illustration 10: Earnings per share for Intel Corporation from 2009 to 2024
The EPS figure itself isn’t the primary focus for value investors—it can be 0.2 or 10, but what truly matters is the company’s ability to generate consistent earnings growth. A steadily increasing EPS over time signals strong financial health, profitability, and long-term value creation.
Intel Corporation’s earnings per share (EPS) performance from 2009 to 2023 presents a mixed picture for investors. While the company has demonstrated resilience and growth in revenue over the long term, its EPS has in recent years been falling quite dramatically and is, as of the moment, strongly negative. This is a red flag due to the company’s inability to convert revenue growth into consistent profit growth, which suggests operational or market challenges. Factors such as increasing competition in the semiconductor industry, delays in product development, and rising costs have likely contributed to the decline in EPS. For investors, the negative EPS signals potential risks in Intel’s ability to sustain profitability, making it an important indicator to monitor moving forward.
Assets and Liabilities
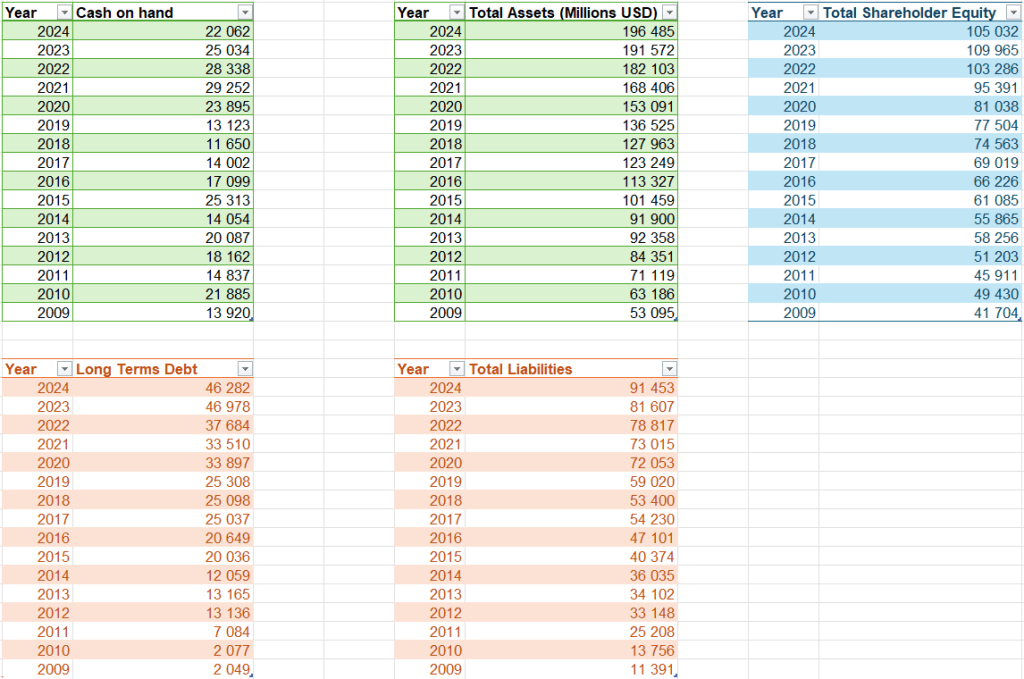

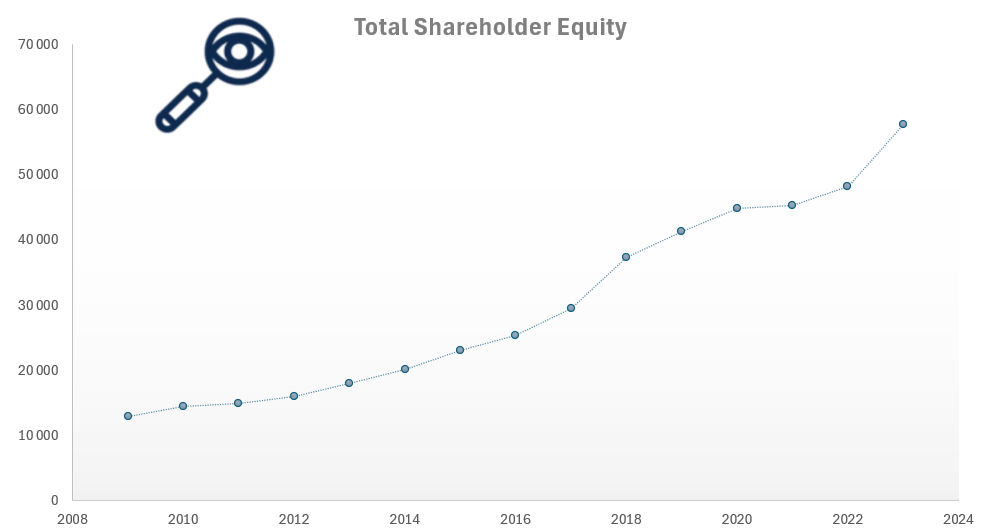
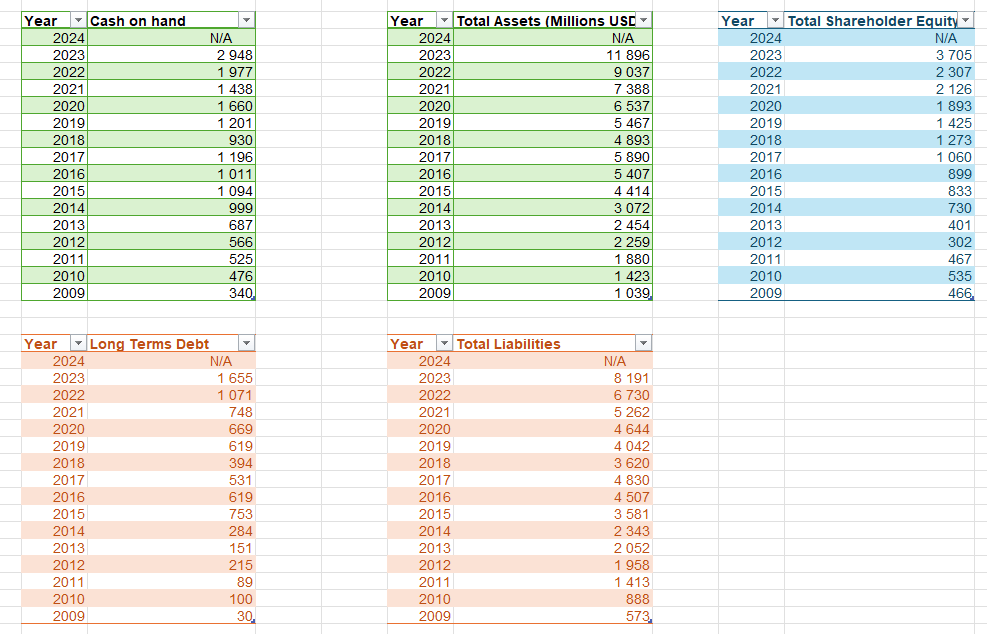
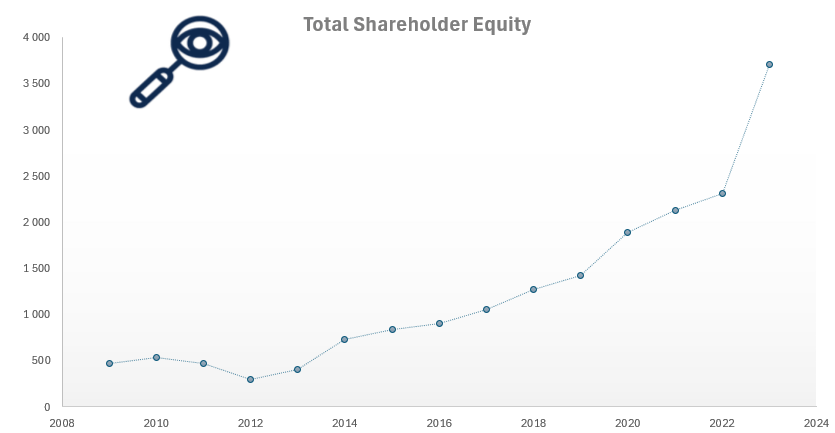
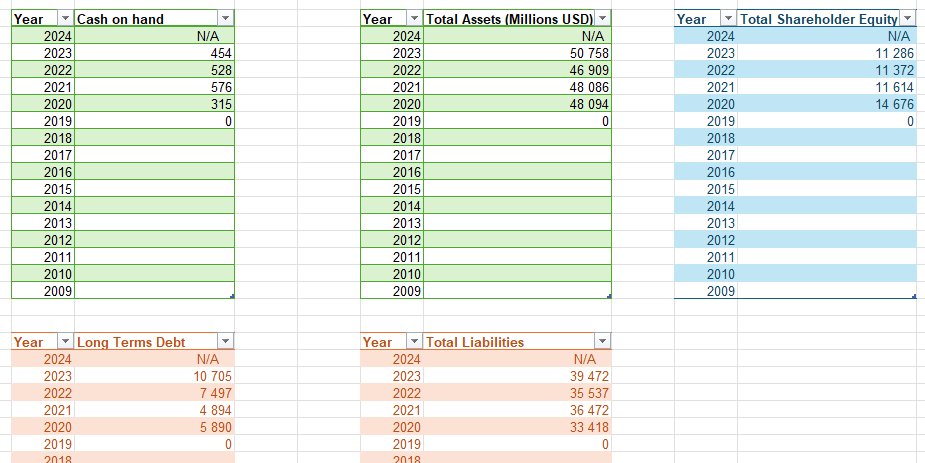
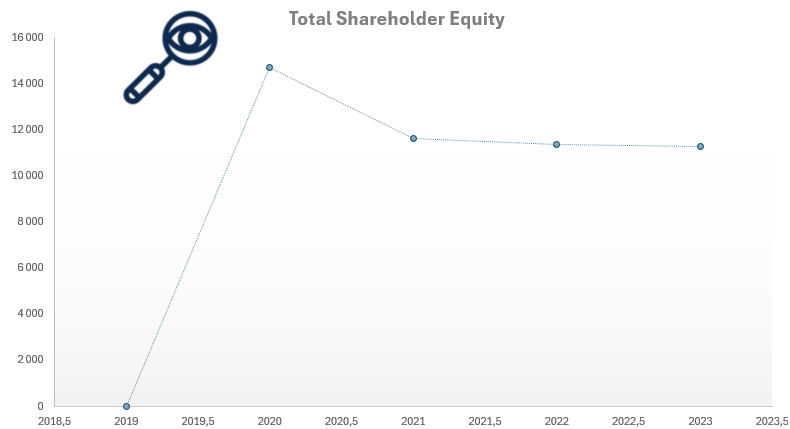
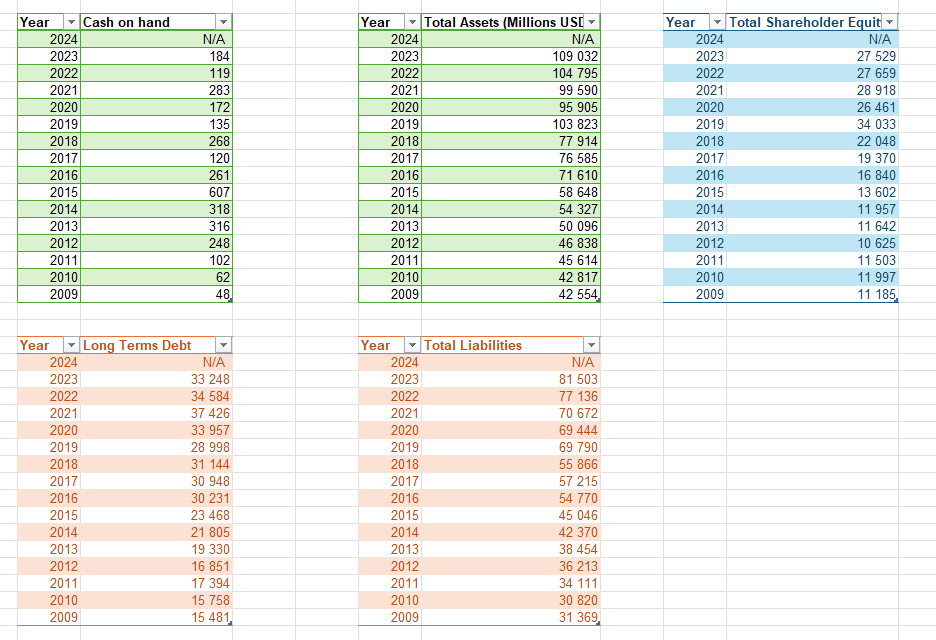
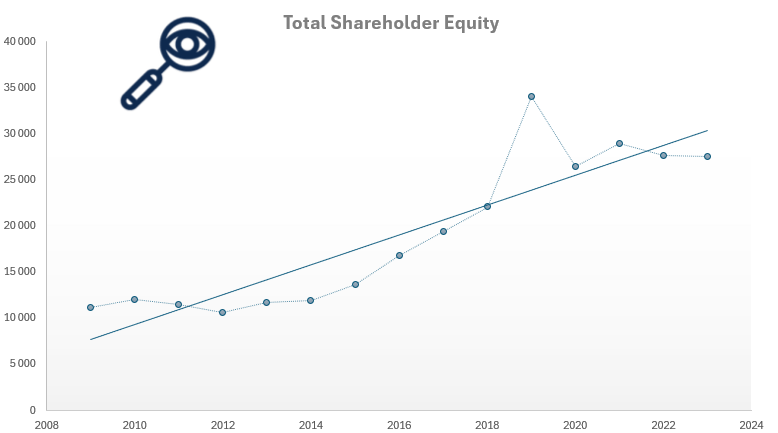
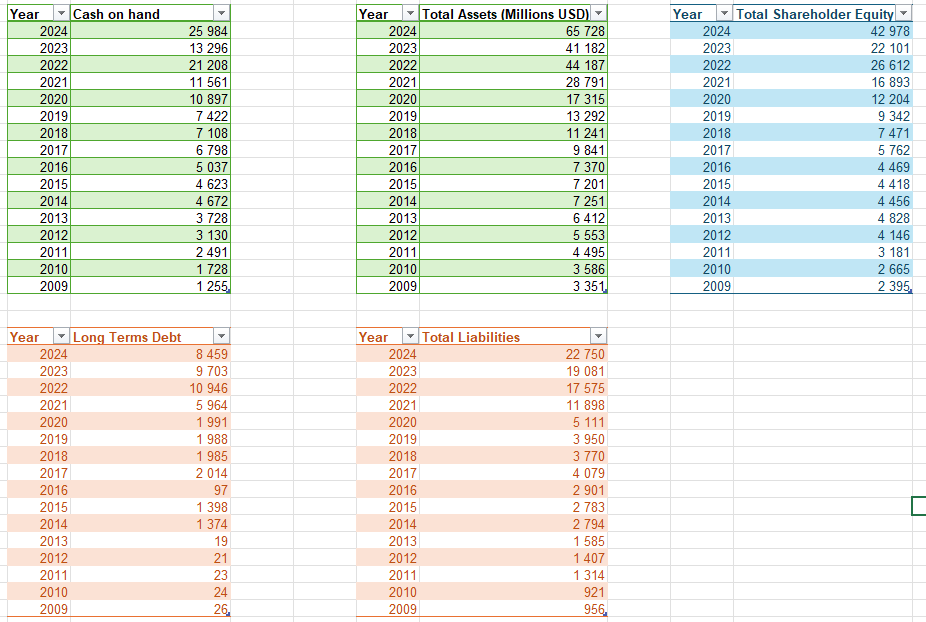
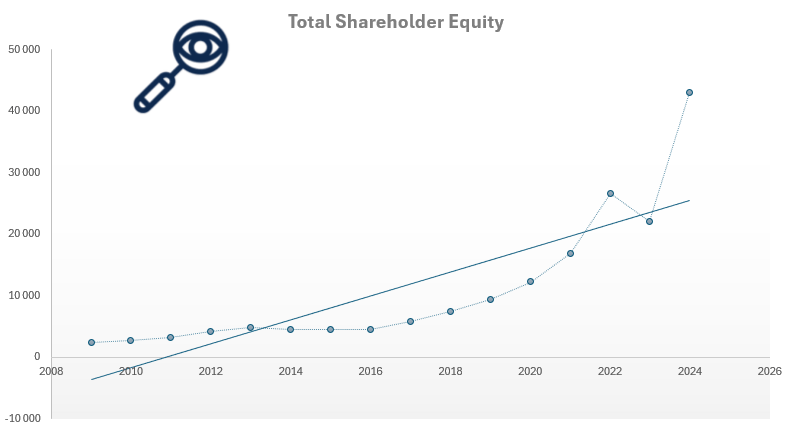
Illustration 11 and 12: Assets, Liabilities and Total Shareholder Equity for Intel Corporation from 2009 to 2024.
When evaluating a company as a potential investment, understanding its assets and liabilities is crucial. If a local business owner offered to sell their shop to you, one of the first questions—after determining its profitability—would be about its equity and assets. The same principle applies when assessing publicly traded companies like Dominion Energy.
As shown in Illustrations 11 and 12, Intel Corporation has a substantial asset base, totaling $196.5 billion in 2024. This steady asset growth over time is a positive sign, indicating that the company is expanding its operations, investing in new technologies, and strengthening its market position. A growing asset base often reflects a company’s ability to scale its business, acquire new projects, and improve its production capacity, which is particularly important in the highly competitive industry Intel is in.
At the same time, Intel Corporation’s total liabilities have also increased significantly, rising from $10.8 billion in 2009 to $72.1 billion in 2024. While such a sharp increase in debt might raise concerns for some investors, it is not necessarily a red flag given the nature of the semiconductor industry. Significant capital expenditures are often required for research and development, as well as for building and upgrading manufacturing facilities to remain competitive. This debt is primarily used to fuel Intel’s innovation and expansion in critical technologies like AI, high-performance computing, and next-generation chips. However, investors should closely monitor Intel’s debt levels and ability to service them, especially in light of recent profitability struggles, to ensure it doesn’t become a long-term risk to the company’s financial health.
The key factor for investors is whether Intel Corporation can effectively manage its debt while maintaining strong revenue and profitability. If the company can generate consistent cash flow and sustain high demand for its products and services, its rising liabilities may not be a major issue. However, if debt levels continue to grow faster than revenue or profits, it could indicate financial strain, making it important for investors to monitor the company’s ability to service its obligations while maintaining profitability.
The cash on hand for Intel Corporation is a red flag for potential investors, as the company has $22 billion in readily available cash as of 2024. This is lower than expected, given the company’s large-scale operations and significant capital expenditures. In addition, its cash on hand is significantly lower than its long-term debt of $46.3 billion as of 2024, which indicates a potential liquidity risk. This imbalance could limit Intel’s ability to respond to unforeseen market challenges or invest in future growth opportunities without relying heavily on additional debt.
As seen in Illustration 11, Total Shareholder Equity—calculated as total assets minus total liabilities—has consistently grown over the past 14 years. This is a positive indicator for potential investors, as it suggests that Intel Corporation is building value over time rather than eroding its financial foundation. A steadily increasing shareholder equity indicates that the company’s assets are growing at a faster rate than its liabilities, which is a green flag for financial health. This trend suggests that Intel Corporation is successfully expanding its operations while maintaining a solid balance sheet. Additionally, rising equity provides a buffer against financial downturns, making the company more resilient in times of economic uncertainty. However, investors should also consider how this growth is achieved—whether through profitable operations or increased debt financing—to fully assess the sustainability of this trend. The recent dip down in total shareholder equity from 2023 to 2024 should also be strongly monitored to make sure it is not the start of a stronger downwards trend.
Debt to Equity Ratio
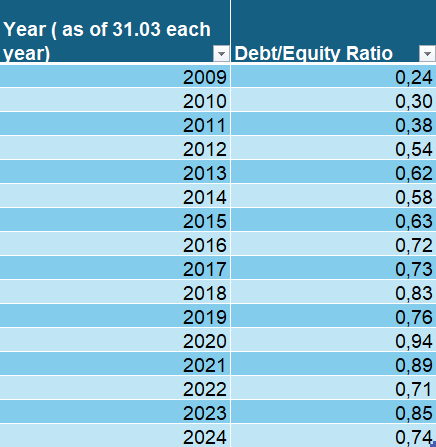
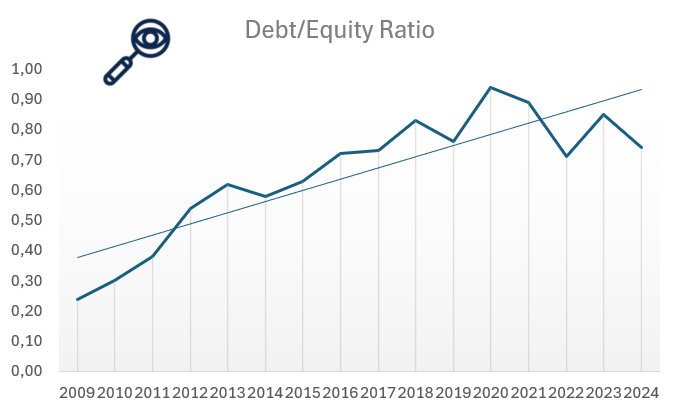
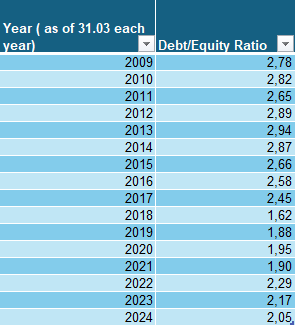
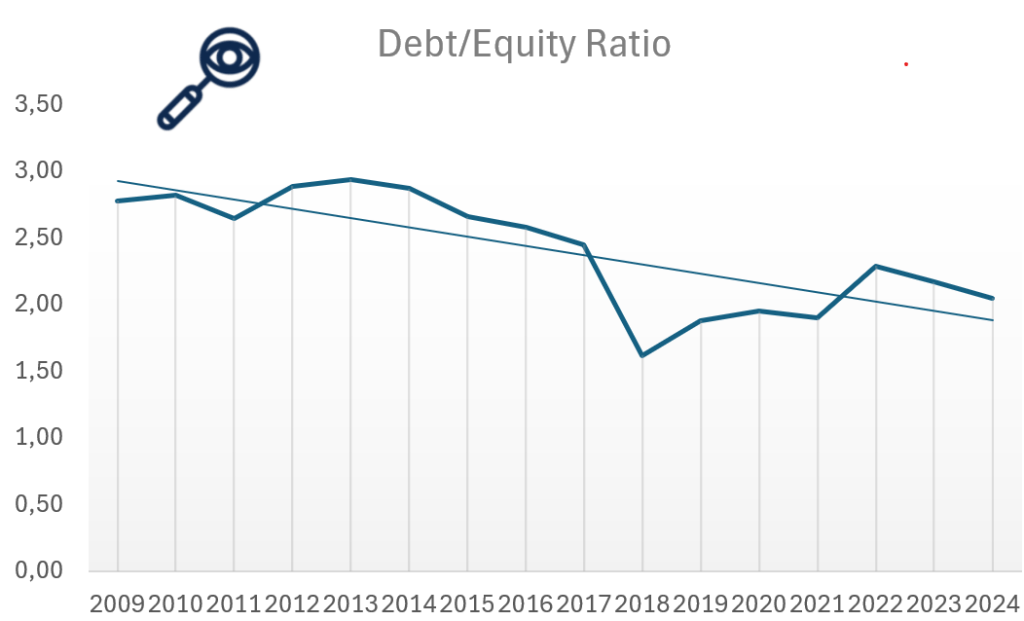
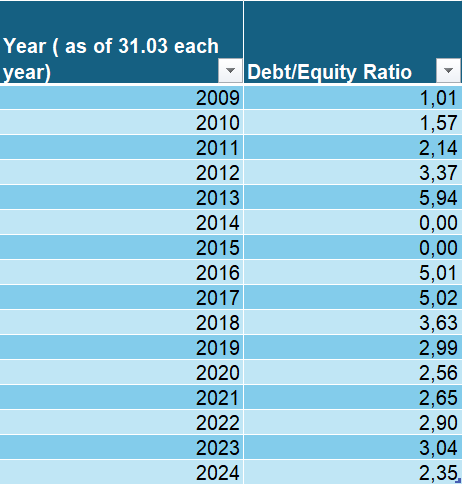
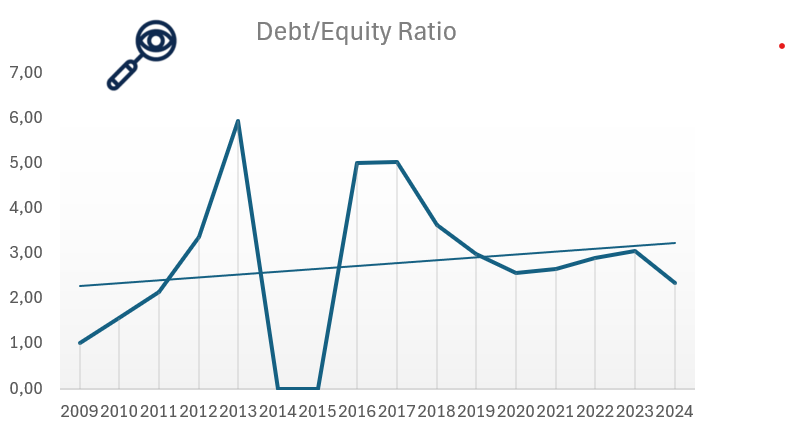
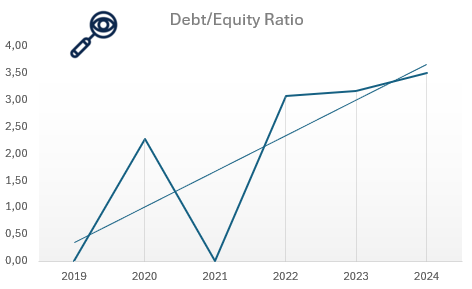
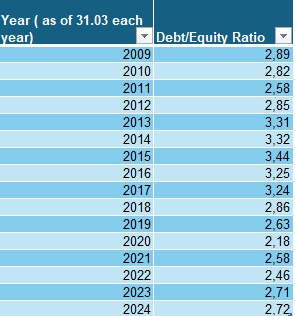
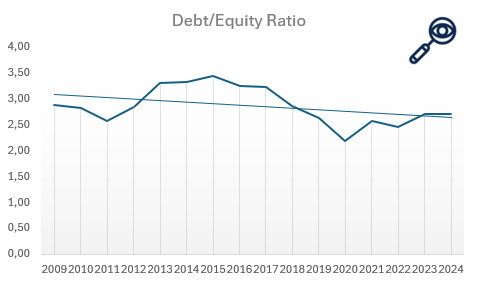
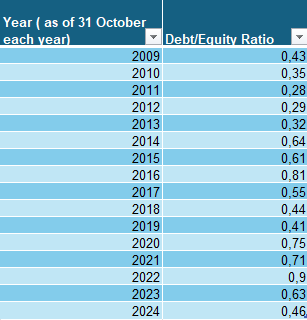
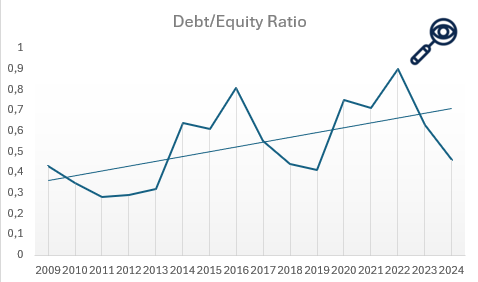
Illustration 12 and 13: Debt to Equity ratio of Intel Corporation
The Debt-to-Equity (D/E) ratio is an important financial metric for assessing a company’s financial leverage and risk. It compares the amount of debt the company uses to finance its operations relative to its shareholder equity. A high D/E ratio suggests that the company relies more heavily on debt to fuel growth, which could increase financial risk, especially during economic downturns when managing debt obligations becomes more challenging. In contrast, a lower D/E ratio indicates that the company is primarily financed through equity, reducing financial risk but potentially limiting its ability to rapidly expand.
Legendary value investor Warren Buffett generally prefers a ratio below 0.5. Intel Corporation’s D/E ratio is currently above that and has been on the rise from 2009 to 2020, which indicates increasing reliance on debt financing over the past decade. This rising trend could suggest concerns about the company’s financial leverage and potential risks in managing its debt load. However, since 2020, it has had a downturn, which indicates a shift towards a more conservative approach in its capital structure. This decline could signal efforts by Intel to reduce its debt and improve financial stability, making it potentially more appealing to long-term investors concerned about excessive debt.
Price to earnings ratio (P/E)
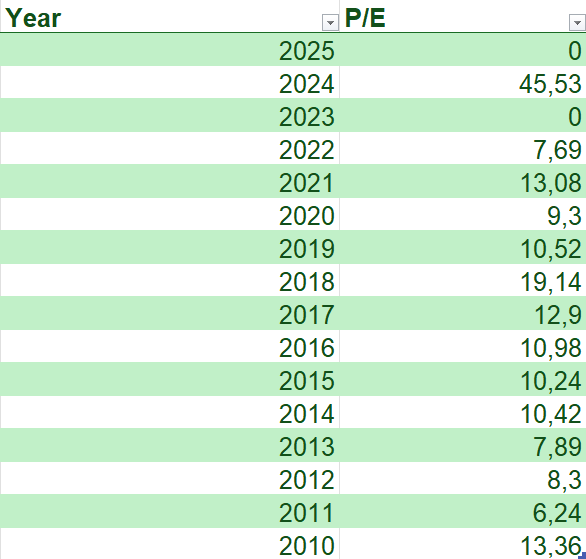

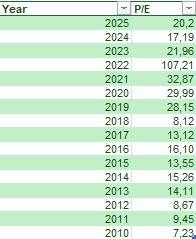
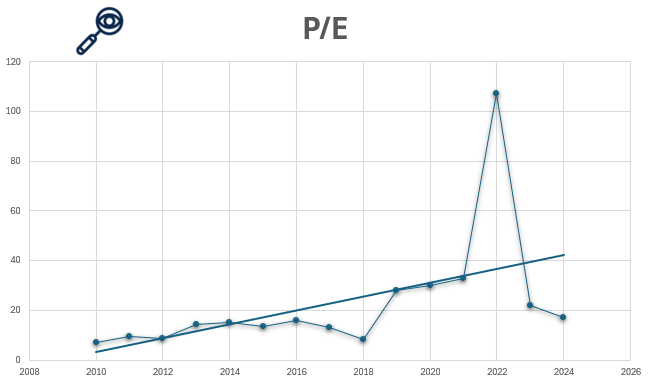
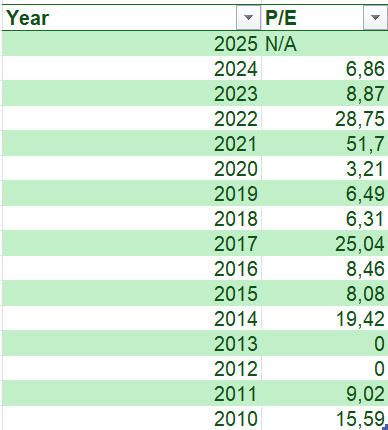
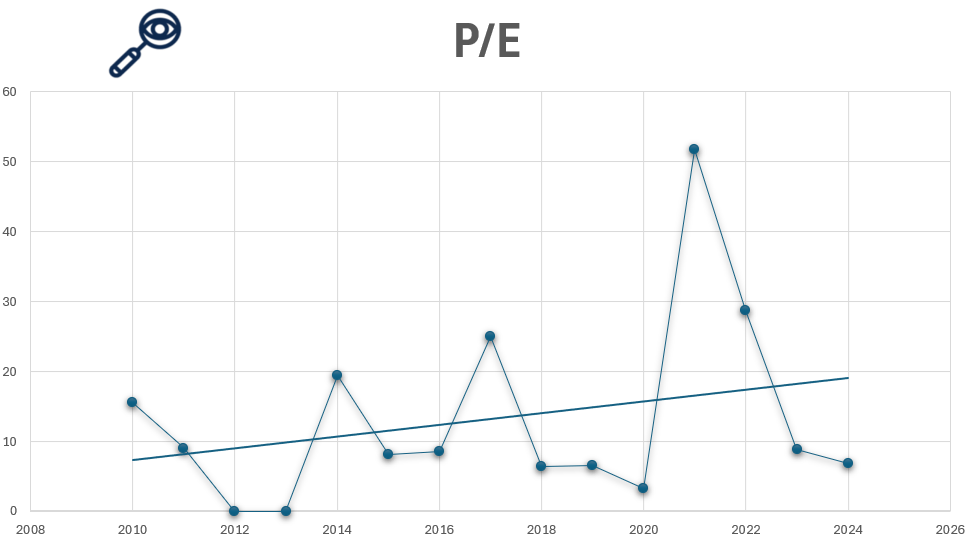
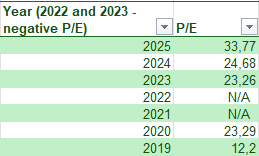
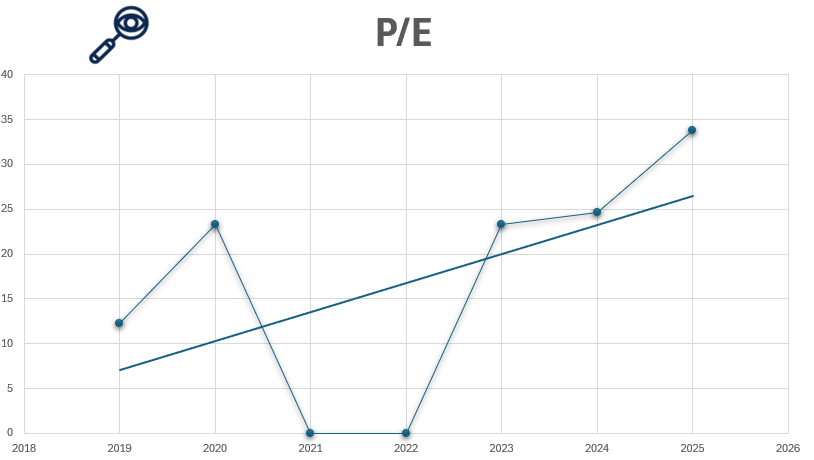
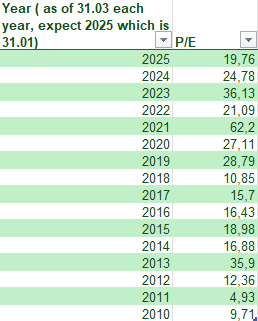
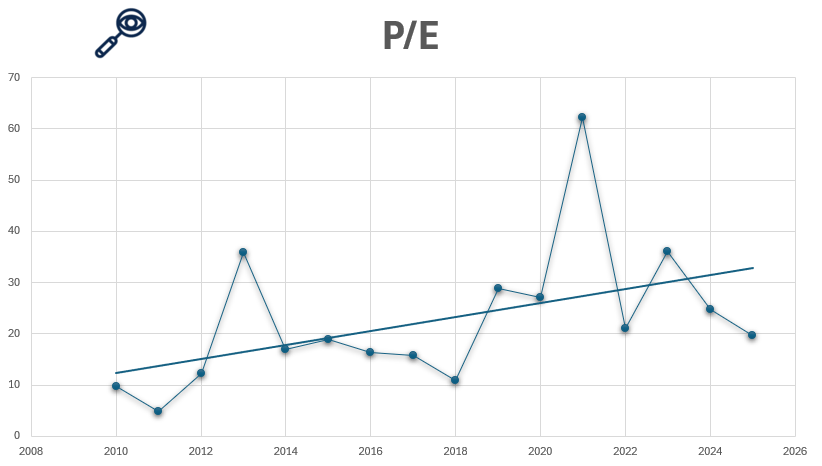
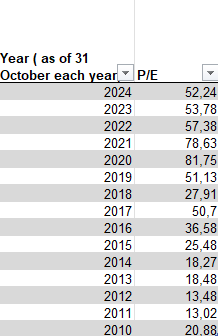
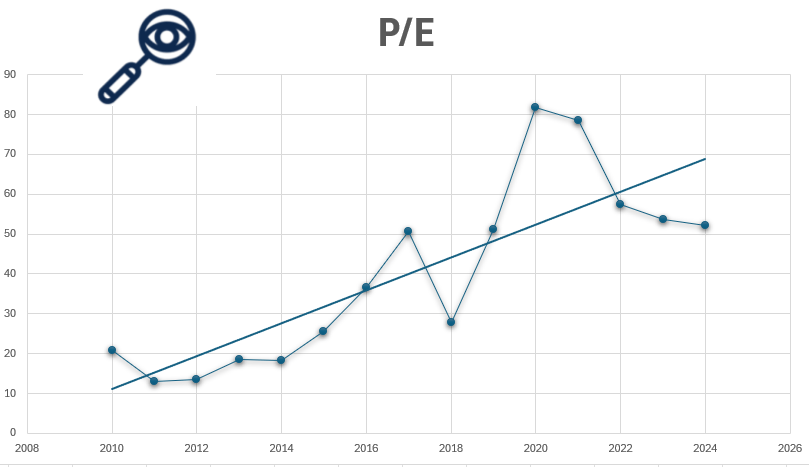
Illustration 14 and 15: Price to earnings ratio for Intel Corporation from 2010 to 2024
For value investors, one of the most critical metrics when evaluating Intel Corporation’s stock is the price-to-earnings (P/E) ratio, as it helps assess whether the company is undervalued or overvalued. Even if a company has strong financials, purchasing its stock at a high price can lead to poor returns. For example, imagine a business generating solid profits of $1 million per year. If the owner offers to sell you the business for just $1, it would be an incredible deal. But if the owner asks for $1 trillion, even though the business is profitable, the price would be absurdly overvalued. The stock market works similarly—companies can be priced cheaply on some days and excessively expensive on others.
Warren Buffett, a legendary value investor, typically considers stocks with a P/E ratio of 15 or lower as “bargains.” A high P/E ratio suggests that investors are paying a premium for the company’s earnings, expecting significant growth. However, this also indicates that the stock is expensive relative to its earnings, which can be a red flag for value investors. Intel Corporation’s P/E has fluctuated in recent years, even being negative in 2023 and jumping to a high of 45.53 in 2023, which indicates a period of strong market expectations and speculative growth. However, this spike in the P/E ratio also raises concerns about the stock being overpriced relative to its actual earnings, making it potentially risky for investors who prefer to buy undervalued stocks. This volatility suggests uncertainty about Intel’s ability to meet the high growth expectations embedded in its valuation. As of now, Intel can be said to be overvalued as its earning are going down, buts its P/E ratio at the same time is going up reaching new hight which is not supported by the Company’s fundamentals.
Price to Book Value
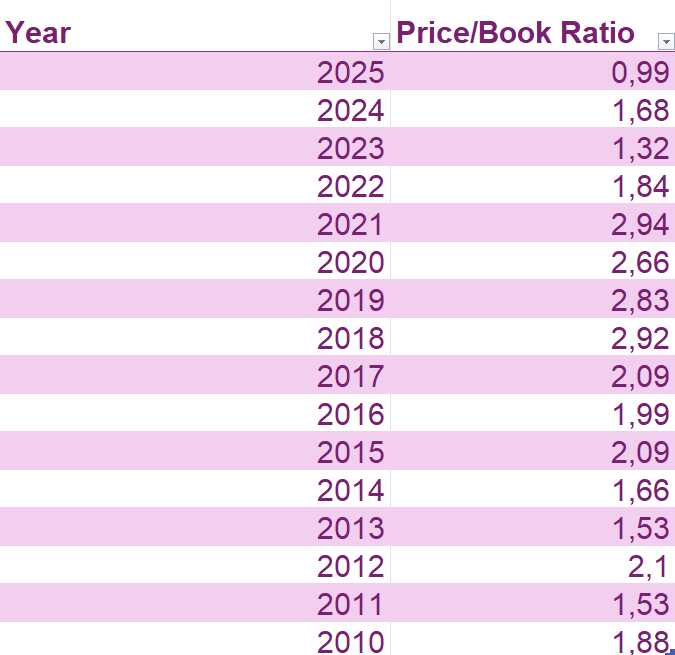
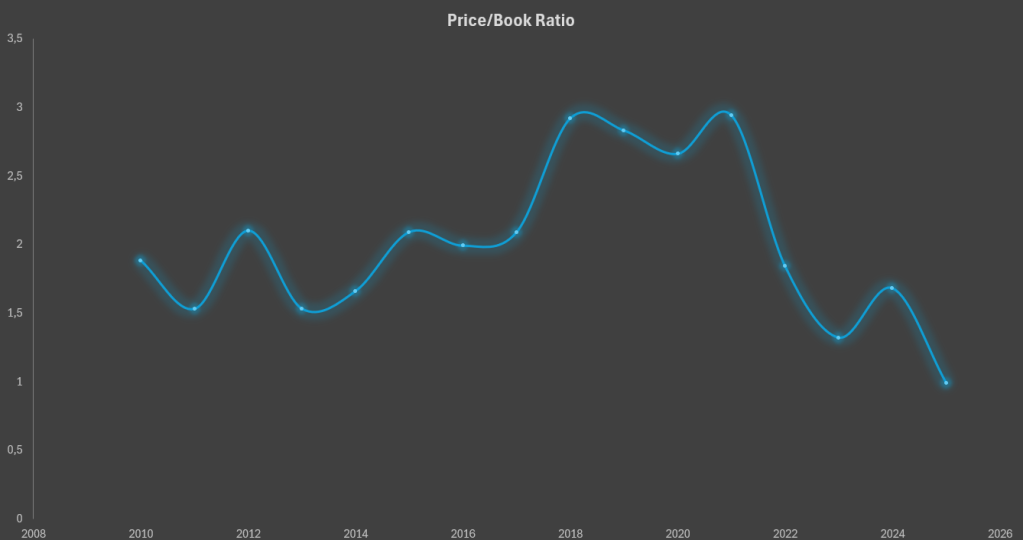
Illustration 16 and 17: Price to Book ratio for Intel Corporation from 2010 to 2025.
Price-to-book value (P/B ratio) is a financial metric used to compare a company’s market value (its stock price) to its book value (the net asset value of the company, calculated as total assets minus total liabilities). The P/B ratio is calculated by dividing the current share price by the book value per share. A lower P/B ratio suggests that the stock may be undervalued, as investors are paying less for the company’s assets than their actual worth. Conversely, a high P/B ratiomay indicate that the stock is overvalued, or that investors expect high growth in the company’s future earnings. The P/B ratio is often used by value investors to assess whether a stock is trading at a fair price based on its underlying assets. Legendary Investor Warren Buffet prefers company’s with P/B lower than 1.5 and often buys around 1.3 or lower.
Intel Corporation’s price-to-book (P/B) ratio has seen notable fluctuations from 2010 to 2025, reflecting varying market perceptions and financial performance. Throughout the 2010s, Intel’s P/B ratio was typically above 2, indicating that investors were willing to pay a premium for its assets, likely due to strong market positioning and expected growth in the semiconductor industry. However, in recent years, the ratio has been more volatile, dropping below 1 in certain periods, signaling potential undervaluation or market skepticism about its future earnings growth, especially with increasing competition and declining margins. As of 2024-2025, Intel’s P/B ratio remains relatively low, suggesting that the stock may be undervalued compared to its book value, which could present a green flag for value investors looking for opportunities. Nevertheless, this could also be a red flag if the low P/B ratio reflects market concerns about Intel’s long-term competitive position, particularly amid shifts in the tech industry.
Dividend
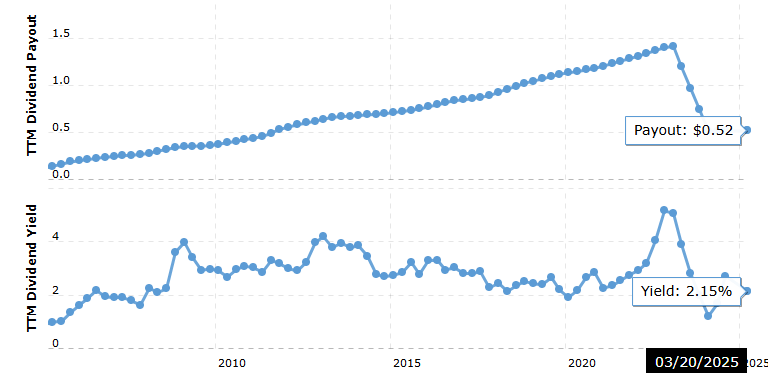
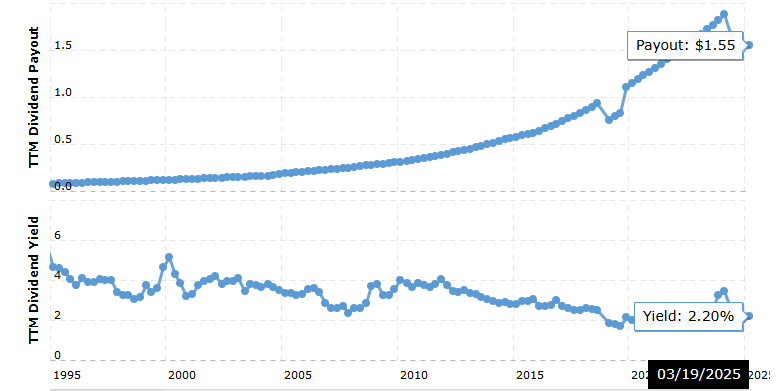
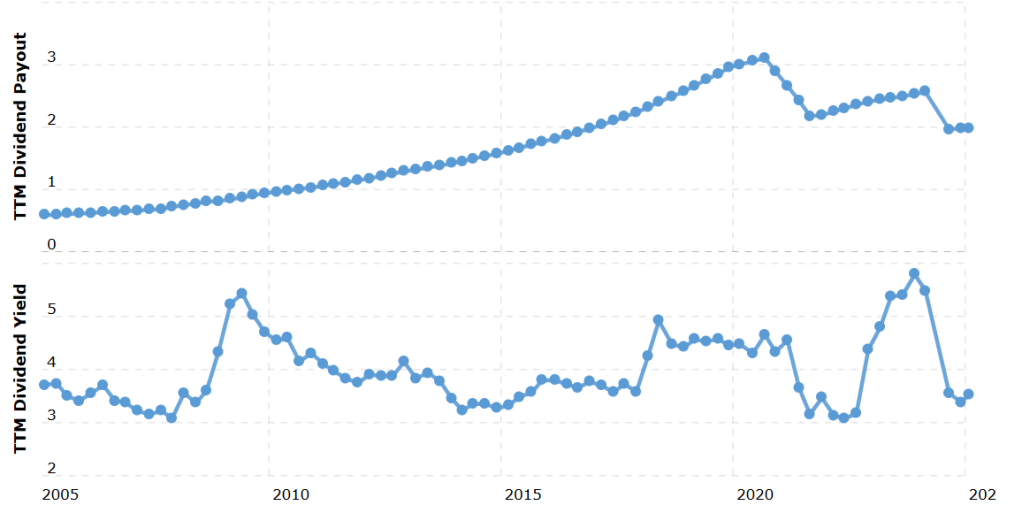
Illustration 18: Intel Corporation Dividend from 2005 to 2025
Intel Corporation has established itself as a reliable dividend payer within the technology sector, offering an annual dividend of $0.52 per share in 2025. This reflects the company’s commitment to rewarding shareholders and maintaining financial stability. Intel has a long history of steady dividend payments, consistently delivering returns to investors, even during periods of market volatility and economic uncertainty. This has made it a favorable choice for income-seeking investors.
However, there are concerns regarding Intel’s dividend yield, which has recently seen a decline, now standing at 2.15%. While the company has consistently raised its dividend since 2005, the first-ever decrease in 2024-2025 to $0.52 per share in 2025 raises red flags. This marks a shift in Intel’s dividend strategy and signals potential challenges ahead, particularly given the capital-intensive nature of the business, including significant investments in research, development, and manufacturing.
To summarize:
✅ Green Flag:
- Reliable Dividend Payouts: Intel has a strong history of dividend payments, making it an appealing option for investors seeking consistent income.
- Long-Term Growth Potential: The company combines steady dividends with prospects for growth in the technology sector.
🚩 Red Flag:
- Declining Dividend Yield: The recent drop in Intel’s dividend yield is concerning for income investors who rely on stable returns.
- Capital Intensity: Intel’s ongoing investments in innovation and capital expenditures raise questions about the long-term sustainability of its dividend payouts.
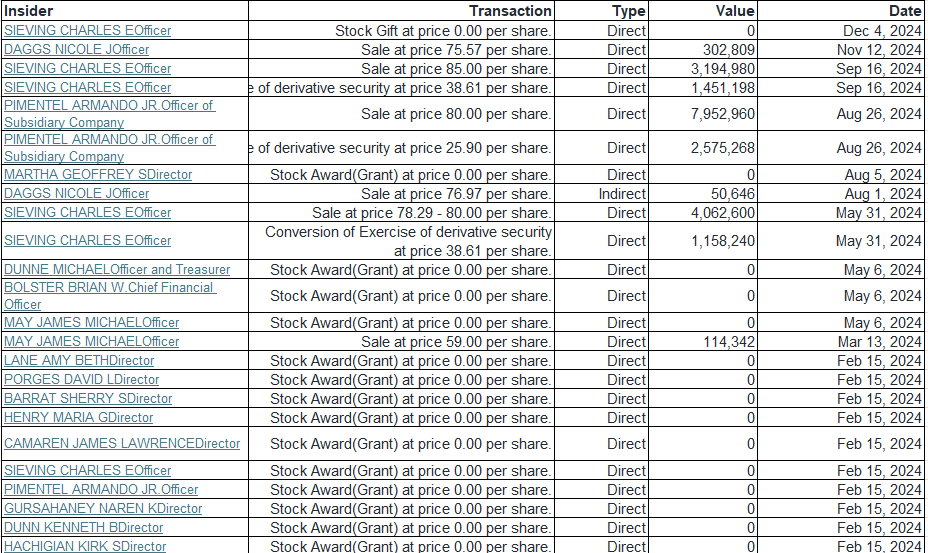
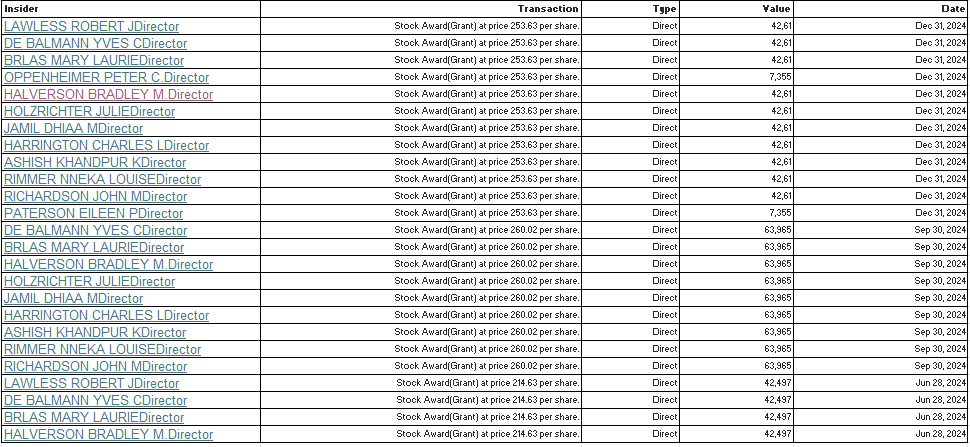
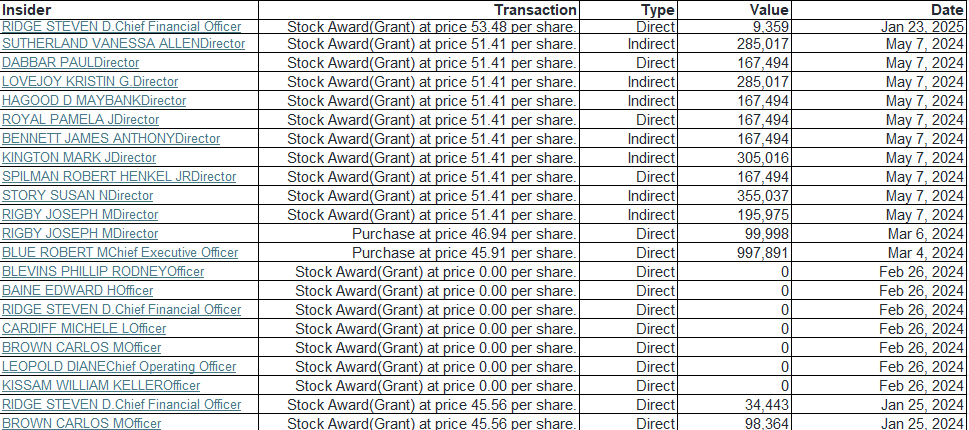
Insider Trading
In 2024, Intel Corporation’s insider trading activities included purchases totaling approximately $882,574, with no recorded sales. The most recent insider transaction was on November 7, 2024, when EVP Michelle Johnston Holthaus sold 25,000 shares at $26.00 per share, amounting to $650,000. In 2025, there were no reported insider purchases or sales; however, option exercises occurred, totaling 108,713 shares. These transactions suggest active insider engagement, but the absence of sales in 2025 may raise some questions.
✅ Green Flag: The lack of insider sales in 2025 and limited purchases in 2024 can be seen as a positive, as it may indicate confidence in the company’s future prospects and a long-term outlook from insiders.
🚩 Red Flag: The lack of insider sales in 2025 could be viewed as a potential red flag by some investors, as it may suggest insiders are not capitalizing on stock opportunities, which could be a sign of caution or internal concerns.
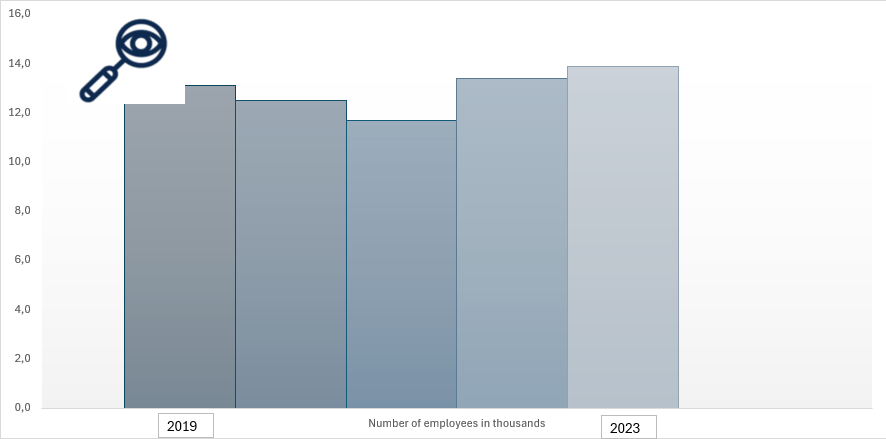
Other Company Information
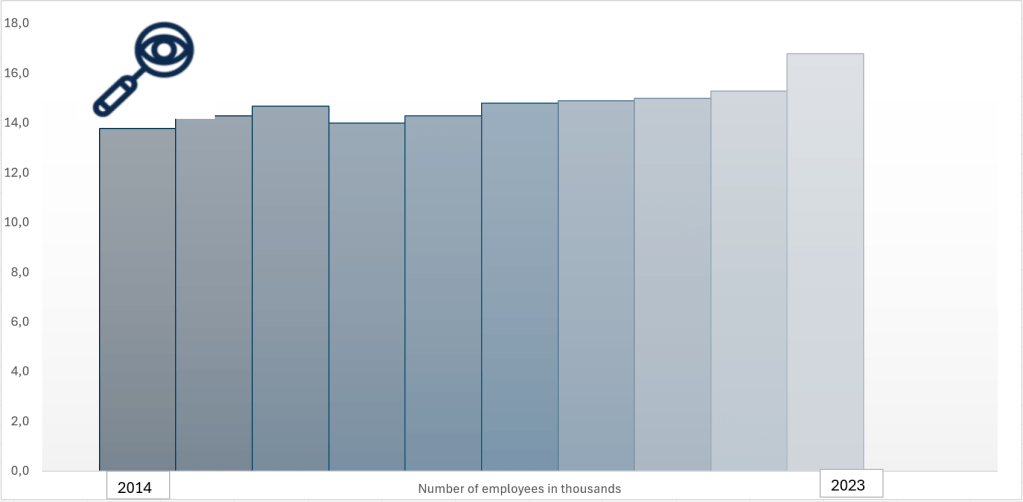
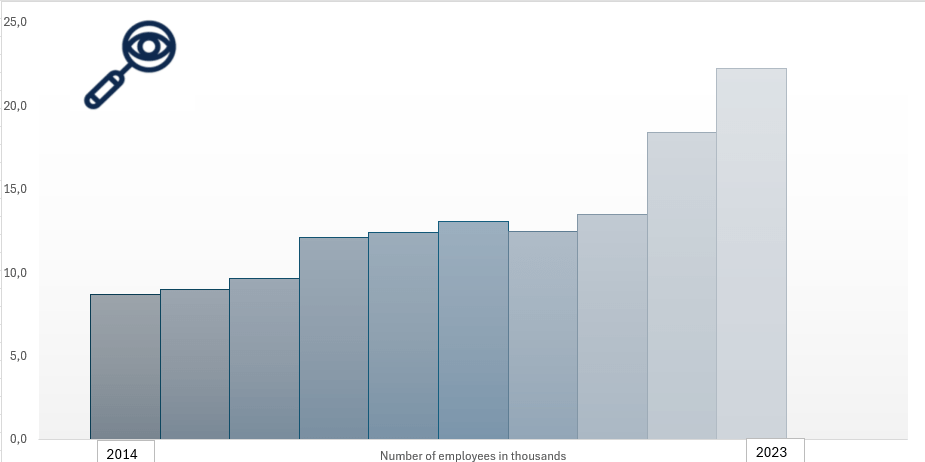
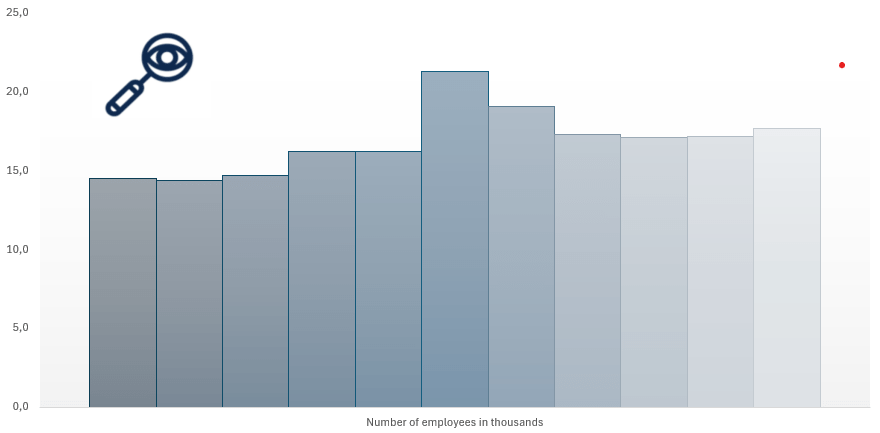
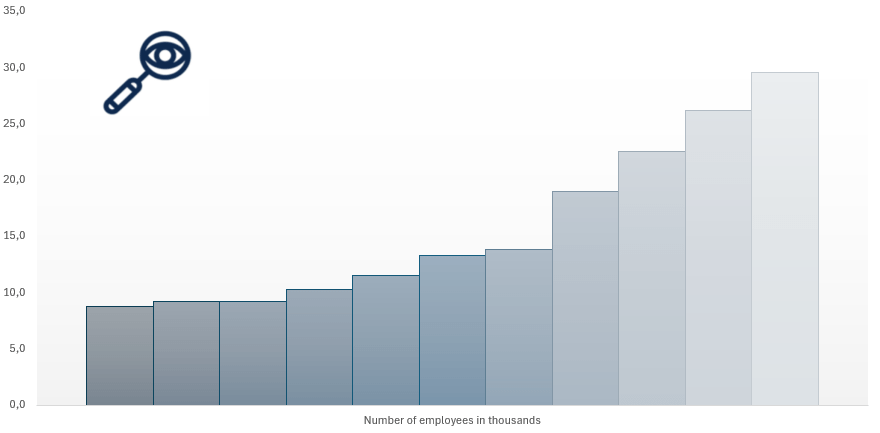
Intel Corporation, founded in 1968, currently employs approximately 121,100 individuals as of 2024, reflecting a steady workforce presence that has grown from 110,000 employees in 2020. Originally established as Integrated Electronics Corporation, Intel is a global leader in semiconductor innovation, particularly known for its microprocessors. The company is publicly traded on the NASDAQ under the ticker symbol INTC. Operating within the Technology sector, Intel is classified under the Semiconductors industry. As of 2024, Intel has approximately 4.1 billion shares outstanding, with a market capitalization of around $100 billion USD.
Headquartered at 2200 Mission College Blvd, Santa Clara, California 95054, United States, Intel’s official website is www.intel.com.
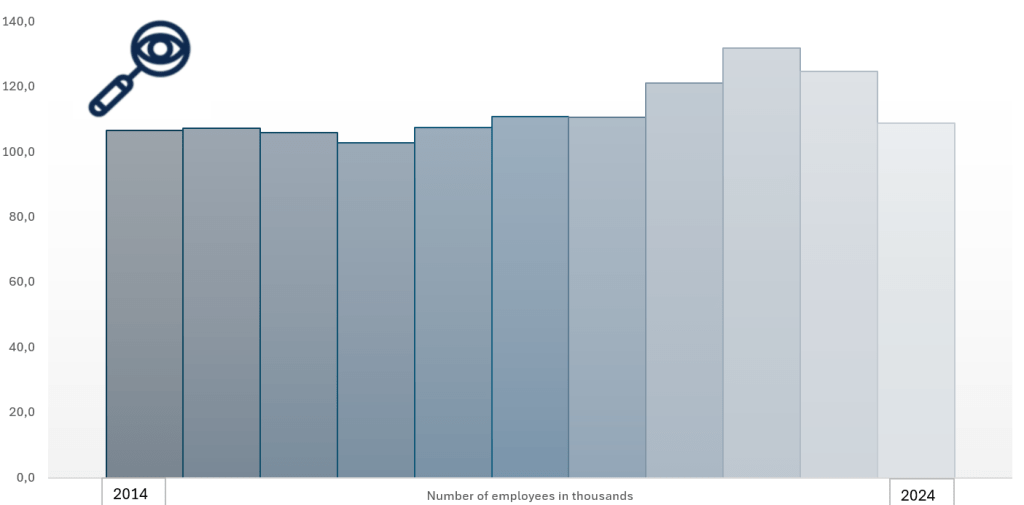


Illustration 19-21: Number of employees at Intel and its headquarters location in Santa Clara.
Final Verdict
Investing in Intel Corporation presents both opportunities and risks. On the positive side, Intel is a leader in semiconductor manufacturing, with a solid history of innovation and consistent dividend payouts. Its diversified portfolio, which includes processors, AI accelerators, and foundry services, positions it well for long-term growth, especially with the increasing demand for advanced technology across multiple sectors. However, recent challenges, such as declining earnings, volatile dividend yields, and increasing competition from companies like AMD and Nvidia, should not be overlooked. It is also not easy to determine if Intel currently is overpriced or not as the P/E ratio and P/B ratio point in different direction. As of now the final conclusion is to be careful and cautious before buying Intel stock.